A SaaS company can spend thousands of dollars on advertising, hire salespeople, publish content, sponsor events, and run product demos without knowing which activities are actually bringing in customers profitably. Looking only at total marketing expenditure does not reveal whether customer acquisition is becoming more efficient or quietly burning through your runway.
Customer Acquisition Cost (CAC) helps founders, finance leads, and engineering executives measure the exact average capital required to win a single new paying customer. However, the calculation is only reliable when the business defines its costs, customer count, reporting period, and attribution methodology with uncompromising consistency.
This practical guide breaks down how to calculate SaaS CAC, which expenses belong in a fully loaded model, how to segment acquisition costs by channel, and how to identify expensive acquisition strategies before they undermine your unit economics.
What is Customer Acquisition Cost (CAC) in SaaS?
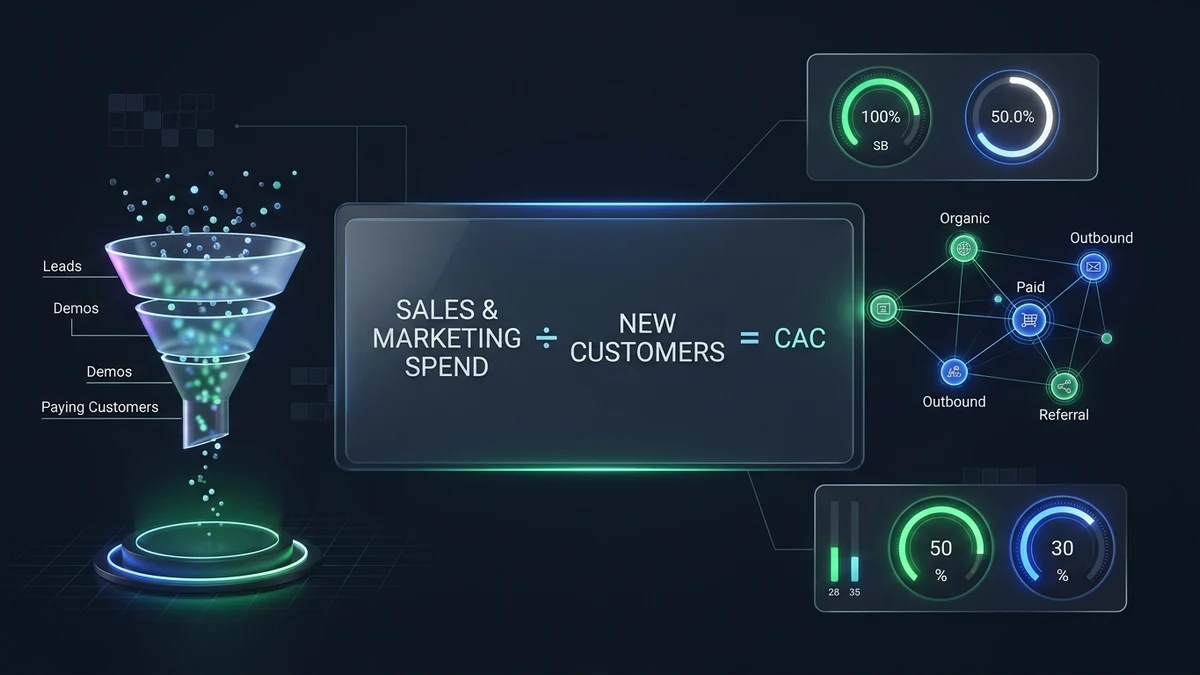
Customer Acquisition Cost is the average sales and marketing expenditure required to acquire one new paying customer during a defined measurement window.
In subscription software, CAC is fundamentally distinct from early-stage funnel metrics:
- Cost per click (CPC): Measures user interest and ad auction efficiency.
- Cost per lead (CPL): Measures contact acquisition and marketing capture efficiency.
- Cost per demo: Measures sales qualification and pipeline generation.
- Cost per free-trial signup: Measures product landing page conversion.
These metrics measure early and middle stages of the acquisition funnel. CAC measures the cost of acquiring an actual paying customer.
For example, suppose a growth campaign generates 500 leads, 40 scheduled product demos, and eight paying customers. The business must calculate CAC using the eight paying customers, not the 500 leads or 40 demos. Confusing pipeline volume with paying conversions produces dangerously understated acquisition numbers.
The SaaS CAC Formula
At its most fundamental level, the mathematical formula for Customer Acquisition Cost is:
CAC = Total Sales & Marketing Acquisition Costs ÷ Number of New Paying CustomersWorked Example:
- Quarterly acquisition expenditure: $30,000
- New paying customers acquired: 100
- CAC = $30,000 ÷ 100 = $300
The company spent an average of $300 to acquire each new paying customer. However, this is a blended CAC: it bundles all marketing dollars and channels together, masking which specific channel was a profit driver and which was capital-destructive.
Step 1: Define What Counts as a New Customer
Before executing a CAC calculation, establish an immutable, company-wide definition of what constitutes an acquired customer. In subscription software, a dependable starting point is a new customer account that has initiated a paid subscription with verified settlement.
Ensure your finance and analytics teams adhere to these governance rules:
- Count paying accounts, not free signups: Freemium registrations and free trials cost money to support but generate zero immediate revenue.
- Do not count unbilled trial registrations: Users on 14-day trials who have not yet cleared payment are prospects, not customers.
- Document reactivated accounts separately: If a customer churned six months ago and reactivates via win-back email, separate reactivation spend and conversions from organic new customer CAC.
- Count accounts once, regardless of seats: If an organization subscribes to an enterprise plan with 50 user licenses, count 1 customer account (unless your unit of economic analysis is specifically per-seat ARPU).
- Define the paid conversion event for product-led growth (PLG): For freemium tiers, pinpoint the exact transaction where the user transitions to a paid tier.
- Keep account-level and user-level calculations distinct: Mixing Average Revenue Per Account (ARPA) with per-seat metrics will distort both CAC and LTV projections.
Step 2: Identify the Costs Included in CAC
Direct advertising expenditure is only one fraction of the true customer acquisition investment. An executive-grade, fully loaded CAC must incorporate all human, software, and external resources deployed to win customer contracts.
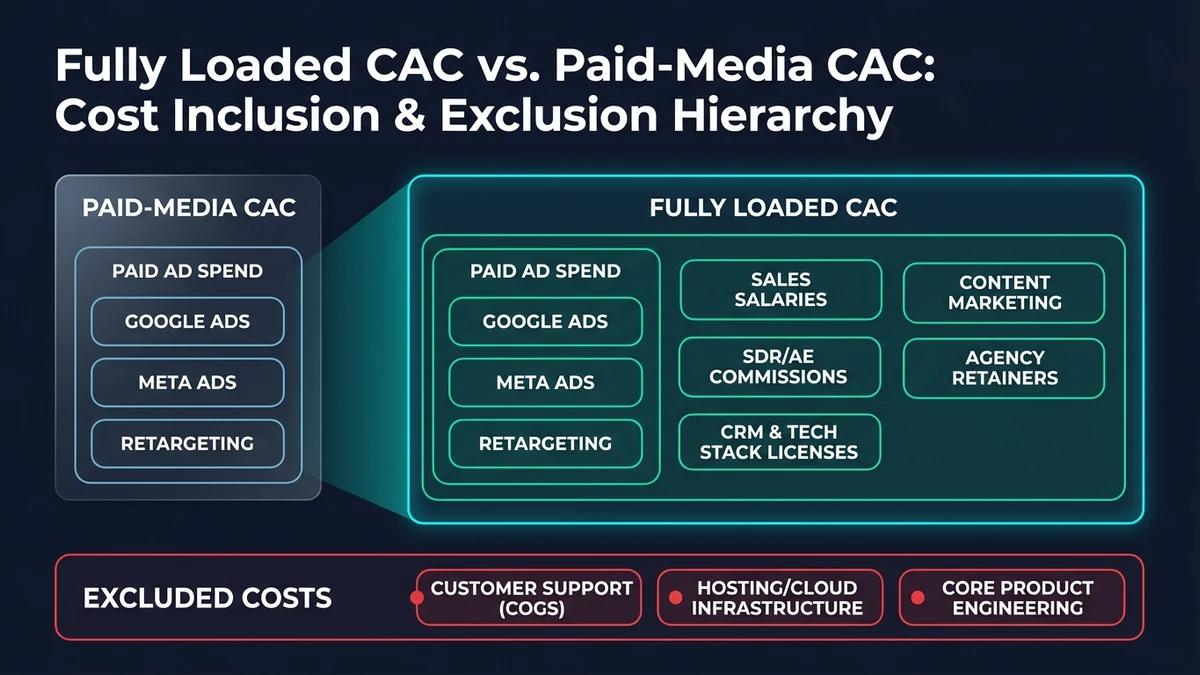
Use this operational audit checklist to determine which expenses to include in fully loaded CAC:
| Expense Category | Include in Fully Loaded CAC? | Accounting Justification & Notes |
|---|---|---|
| Google, LinkedIn & Meta advertising | Yes | Direct acquisition capital spent on media, keywords, and sponsored placements. |
| Sales & marketing salaries | Yes | Base pay and payroll benefits for SDRs, account executives, and growth marketers. |
| Sales commissions & bonuses | Yes | Direct incentive payout triggered by closing new customer subscription revenue. |
| Marketing software & CRM | Yes | HubSpot, Salesforce, lead enrichment APIs, and analytics allocated consistently. |
| Content & campaign production | Yes | Technical copywriting, design mockups, video assets, and inbound SEO articles. |
| SEO & marketing agencies | Yes | External agency retainers, PPC consultants, and PR firms dedicated to growth. |
| Conferences & event sponsorships | Yes | Booth fees, travel, collateral, and hospitality tied to lead generation. |
| Customer support / Success | Usually No | Belongs in Cost of Goods Sold (COGS) to calculate Gross Margin, not acquisition. |
| Core product engineering | No | Classified as R&D operational expense, unless an engineer builds pure growth tools. |
| Cloud hosting & servers | No | Direct service delivery costs (COGS). See our infrastructure cost breakdown. |
Fully Loaded CAC vs. Paid-Media CAC
Both metrics serve essential but distinct operational purposes:
- Paid-Media CAC: Divides ad platform spend by acquired customers. Use this to optimize ad creative, compare keyword groups, and allocate monthly marketing budgets across Google, Meta, or LinkedIn.
- Fully Loaded CAC: Incorporates sales salaries, commissions, tooling licenses, content creation, and agency overhead. Use this to evaluate holistic business model viability, corporate burn rate, and board-level unit economics.
Step 3: Choose the Right Reporting Period and Timing
Calculating CAC on a monthly cadence is operationally convenient, but for B2B SaaS businesses with long sales cycles, monthly period CAC can be severely misleading.
For example, an enterprise software company might deploy $30,000 on LinkedIn account-based marketing in January. If the enterprise sales cycle requires 60 to 90 days for procurement and security review, those leads will not convert into paying customers until March or April. Dividing January's marketing spend by January's conversions produces a distorted, artificial CAC spike.
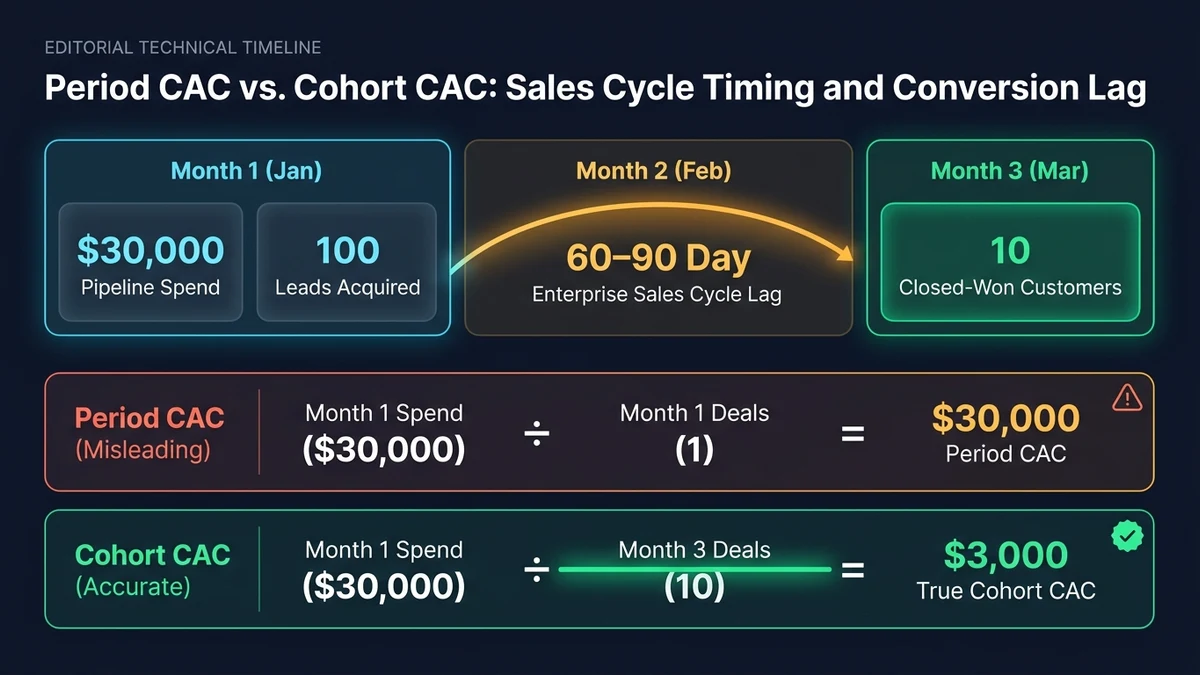
To resolve this distortion, distinguish between two accounting methodologies:
- Period CAC: Total acquisition costs recorded in a calendar window divided by total paying customers acquired in that same window. Suitable for self-serve, low-friction products where visitors convert within days.
- Cohort CAC: Acquisition costs expended to generate a specific group of leads or pipeline, divided by the customers ultimately closed from that cohort over time. Essential for enterprise sales cycles exceeding 45 days.
Step 4: Calculate CAC by Acquisition Channel
Evaluating only blended CAC hides profound variances across acquisition channels. An aggregate $400 CAC can obscure a wildly efficient organic engine and an unsustainable outbound sales process.
Consider this worked channel breakdown across 100 newly acquired customer accounts:
| Acquisition Channel | Channel Expenditure | New Customers | Channel CAC | Economic Context |
|---|---|---|---|---|
| Organic search (SEO & Inbound) | $8,000 | 40 | $200.00 | Lowest acquisition cost; high compound volume over time. |
| Partner referrals & Affiliates | $5,000 | 15 | $333.33 | High conversion intent and rapid decision velocity. |
| Paid search & Social ads | $12,000 | 30 | $400.00 | Predictable and instantly scalable, but sensitive to ad bid inflation. |
| Outbound sales (SDRs & Execs) | $15,000 | 15 | $1,000.00 | Highest CAC; justified if annual contract value (ACV) is high. |
| Blended Total | $40,000 | 100 | $400.00 | Aggregate average across all inbound and outbound motions. |
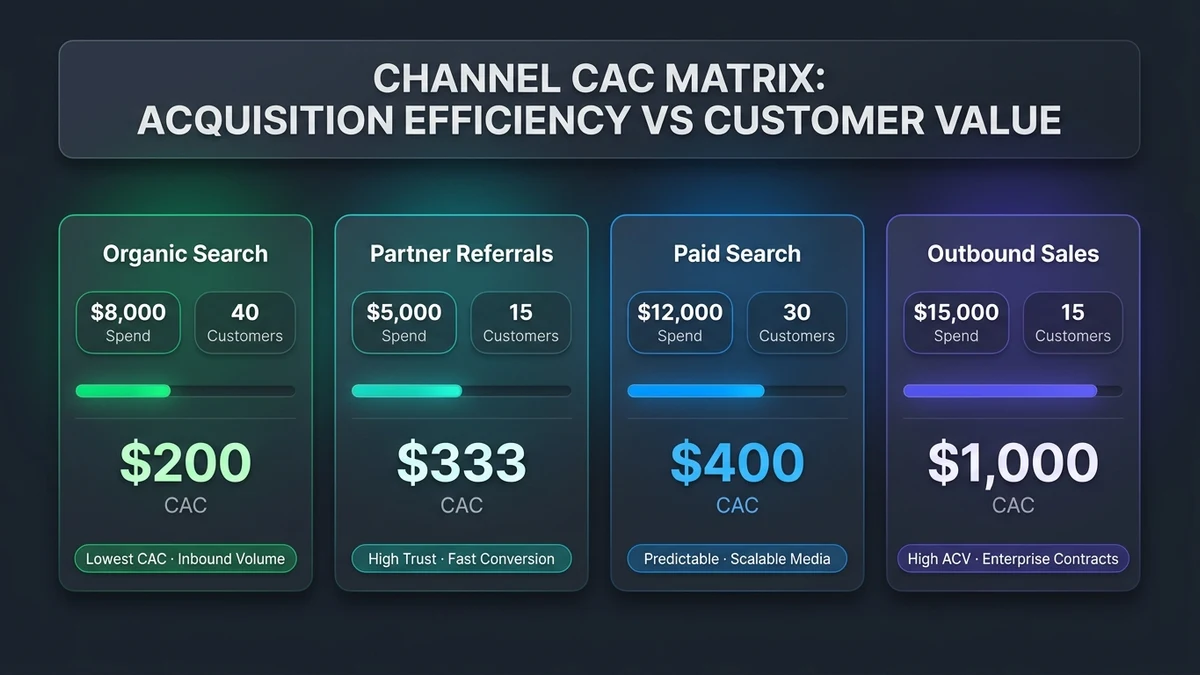
The Strategic Insight: Organic search delivers the lowest CAC ($200), while outbound sales costs five times as much ($1,000). However, this does not mean outbound sales should be eliminated.
If outbound sales accounts sign annual contracts at $12,000 ACV with 95% retention, spending $1,000 to win them represents a stunning 12:1 value-to-cost ratio. Conversely, if paid search customers sign $30/month self-serve plans and churn after three months ($90 total revenue), that "$400 CAC" results in severe capital destruction. Always evaluate CAC alongside Customer Lifetime Value (LTV), Gross Margin, and Payback Period.
Step 5: Segment CAC by Customer Type and Tier
Different customer tiers require vastly different acquisition motions. A self-serve SMB subscriber might convert through a credit card form within five minutes of reading a blog post. An enterprise customer demands customized demonstrations, RFP security audits, procurement approvals, legal reviews, and multiple executive meetings.
Segment your acquisition calculations across:
- Customer Tier: SMB, Mid-Market, and Enterprise.
- Sales Motion: 100% Self-service Product-Led Growth (PLG) vs. Sales-Assisted vs. High-Touch Enterprise.
- Geography: Domestic vs. International markets (accounting for localized ad rates and payment methods).
- Billing Cadence: Monthly recurring billing vs. Annual prepaid upfront contracts.
Worked Financial Model: Calculate Fully Loaded SaaS CAC
Consider an illustrative B2B software company conducting an end-of-quarter financial review. The company recorded the following acquisition expenditures:
| Acquisition Expense Line Item | Quarterly Allocation |
|---|---|
| Paid advertising (Search, Social & Display) | $18,000 |
| Marketing team payroll & benefits allocation | $12,000 |
| Sales salaries, SDR comp & commissions | $20,000 |
| CRM, marketing automation & sales tooling | $3,000 |
| Technical content, design & campaign production | $7,000 |
| Agency retainers & specialist contractor fees | $5,000 |
| Total Acquisition Investment | $65,000 |
During this quarter, the sales and marketing motions produced 130 new paying customer subscriptions.
Fully Loaded CAC = $65,000 ÷ 130 = $500 per new customerThe business invested an average of $500 to secure each new paying customer.
Now assume the prior quarter’s CAC was $450. The observed increase is $50, or an 11.1% increase. While an increase warrants immediate investigation, it does not necessarily indicate deteriorating marketing performance. The company may have closed more enterprise-tier accounts with larger deal sizes, or incurred early content investments whose customer conversions will land in the upcoming quarter.
Interactive SaaS CAC Calculator
Use this interactive engineering calculator to test your own acquisition economics. Switch between Fully Loaded and Paid-Media modes, model multi-channel attribution, and benchmark your CAC Payback period in real time.
SaaS Customer Acquisition Cost (CAC) Calculator
Reporting Scope
Configure your reporting timeframe and expense coverage
* Count new paying subscription accounts only. Do not include free trials or leads.
How to Interpret Rising or Falling SaaS CAC
A shifting CAC metric is a diagnostic signal. Use this diagnostic matrix to interpret trends accurately:
| Observation | Root Operational Explanations | Recommended Executive Action |
|---|---|---|
| CAC increases | Rising ad bid competition; website landing page friction; lengthened sales cycle. | Audit ad creative; optimize conversion rate (CRO); refine qualification criteria. |
| CAC decreases | Higher organic compounding; improved trial onboarding; strong word-of-mouth. | Verify customer quality and churn rates to ensure you aren't acquiring low-retention accounts. |
| Monthly CAC fluctuates wildly | Low sample size; seasonal demand swings; timing disconnect in sales cycles. | Transition from 30-day period CAC to rolling 90-day cohort attribution. |
| Paid CAC drops but Blended CAC rises | Ad spend is efficient, but sales headcount, software tools, or agency costs expanded. | Audit non-media overhead; review sales team quotas and commission structures. |
| Enterprise CAC is 5x SMB CAC | Natural reflection of high-touch procurement, legal reviews, and dedicated sales reps. | Ensure Enterprise ACV, expansion revenue, and gross profit justify the longer payback. |
10 Common SaaS CAC Calculation Mistakes
- 1. Counting leads instead of paying customers: Dividing spend by MQLs or email signups drastically underestimates true customer acquisition capital.
- 2. Excluding sales and marketing compensation: Reporting only ad spend while ignoring salaries paints an artificially optimistic picture of unit economics.
- 3. Mixing account-level and seat-level units: Grouping multi-seat enterprise accounts with individual consumer accounts skews average metrics.
- 4. Comparing timeframes with mismatched cycle lengths: Matching January LinkedIn ad spend against January enterprise closes distorts reality when sales cycles take 90 days.
- 5. Ignoring tooling and agency retainers: Overlooking HubSpot, ZoomInfo, or agency fees hides substantial cash outlays.
- 6. Inconsistent allocation policies: Changing how shared team members or tools are split between acquisition and retention from quarter to quarter.
- 7. Double-counting expenses: Including customer onboarding salaries in both Sales CAC and Support COGS.
- 8. Assuming the cheapest channel is always the best: An ultra-low CAC channel that brings high-churn users is financially destructive.
- 9. Treating small monthly samples as definitive: Overreacting to short-term spikes caused by random deal timing.
- 10. Shifting customer definitions across periods: Changing what qualifies as a "customer" to make board decks appear more favorable.
How to Reduce SaaS CAC Without Damaging Customer Quality
Reducing Customer Acquisition Cost should never mean cutting marketing expenditure indiscriminately or slashing product quality. Instead, sustainable CAC reduction focuses on eliminating acquisition friction, improving qualification, and compounding organic leverage.
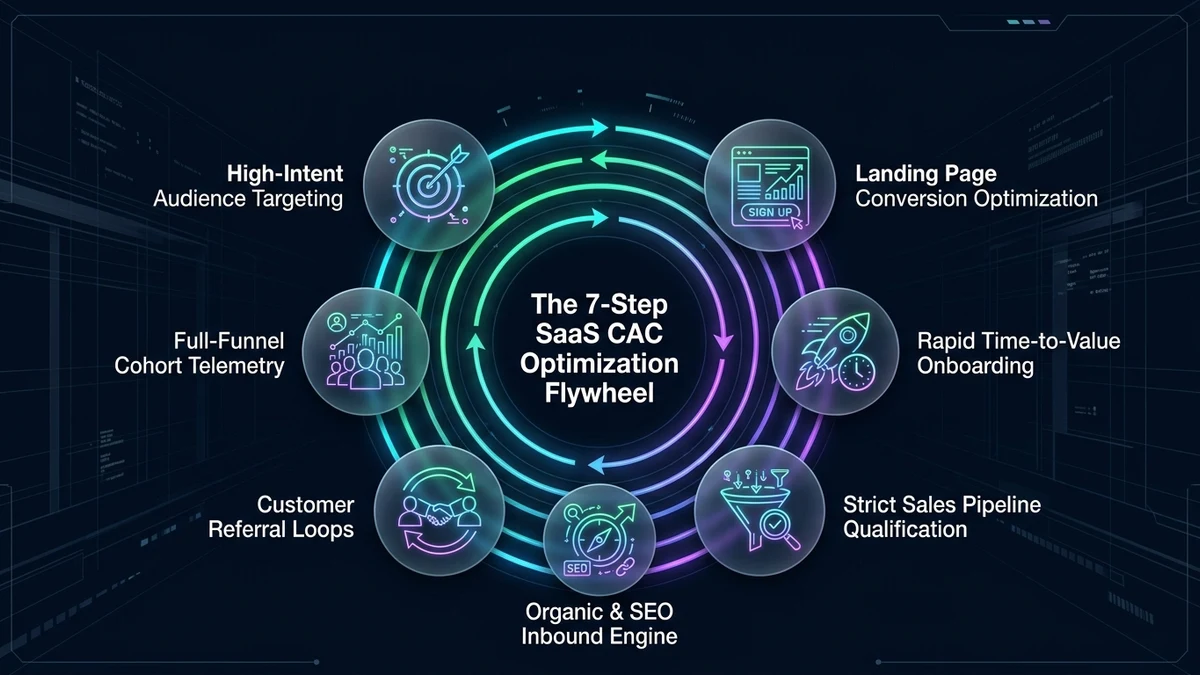
- 1. Sharpen Audience Targeting: Eliminate wasted ad spend by focusing campaigns on accounts that exhibit immediate intent, budget authority, and clear architectural fit. Negative keyword lists and firmographic exclusions instantly improve spend efficiency.
- 2. Optimize Landing Page Experience: Eliminate confusing jargon. Clearly communicate core product value, transparent pricing tiers, customer proof points, and an effortless sign-up path.
- 3. Accelerate Onboarding Time-to-Value (TTV): Guide new users to their "aha moment" within their first session. Faster time-to-value directly accelerates free-to-paid conversion rates.
- 4. Enforce Strict Sales Pipeline Qualification: Don't waste valuable AE hours demoing prospects who lack budget or technical need. Disqualify early and prioritize high-propensity buyers.
- 5. Invest in an Organic Technical Inbound Engine: Publishing high-authority technical guides, comparison frameworks, and documentation generates high-intent search traffic that compounds over years with near-zero marginal acquisition spend. Read our analysis on selecting the Best CMS for Startups in 2026 to support organic growth.
- 6. Build Customer & Partner Referral Loops: Introduce structured incentives for existing satisfied clients and agency partners to recommend your platform. Referral leads boast the highest conversion rates and fastest payback velocity.
- 7. Implement Full-Funnel Cohort Telemetry: Track visitor-to-lead, lead-to-demo, demo-to-trial, and trial-to-paid metrics. Isolating drop-offs allows engineering and product teams to target high-leverage bottlenecks.
Monthly SaaS CAC Executive Reporting Template
Executive teams should review unit economics on a predictable monthly cadence. Use this structured reporting format during board and operating reviews:
| Executive Reporting Field | Operating Metric & Governance Definition |
|---|---|
| Reporting Period | Current Month or Quarter (with rolling 3-month comparison). |
| CAC Methodology | Document explicitly: Paid-Media CAC vs. Fully Loaded CAC. |
| Total Eligible Expenditure | Total sales & marketing spend (ads, salaries, tools, agencies). |
| New Paying Customers Acquired | Net new paid subscription accounts activated and settled. |
| Blended CAC | Total expenditure divided by total new paying customer accounts. |
| Channel CAC Breakdown | Individual CAC and customer share for Organic, Paid, Outbound, and Referrals. |
| Segment CAC | CAC isolated by customer tier (Self-serve SMB vs. High-touch Enterprise). |
| CAC Payback Period (Months) | CAC ÷ (Monthly ARPU × Gross Margin %). Target: <12 months for SMB, <18 for Enterprise. |
| LTV:CAC Ratio | Gross-margin-adjusted LTV divided by CAC. Target benchmark: 3:1 or higher. |
| Operational Action Plan | Specific corrective interventions assigned to department leads for rising CAC channels. |
Conclusion: Make CAC a Decision Metric, Not a Vanity Dashboard
A dependable SaaS Customer Acquisition Cost calculation begins with an uncompromising definition of a paying customer, rigorous accounting of fully loaded sales and marketing expenses, and a reporting cadence that accurately mirrors your company’s sales cycle.
From there, engineering leaders and founders can move beyond a superficial blended number to uncover the true financial health of individual marketing channels, customer segments, and go-to-market motions. Use Paid-Media CAC to optimize ad bidding and creative, Channel CAC to allocate capital across acquisition sources, and Fully Loaded CAC to steer company-wide capitalization and cash runway.
The ultimate goal of acquisition analysis is not simply to spend less. It is to build a durable, repeatable customer engine that predictably brings in the right customers at a cost your business model can sustainably compound over the long term.