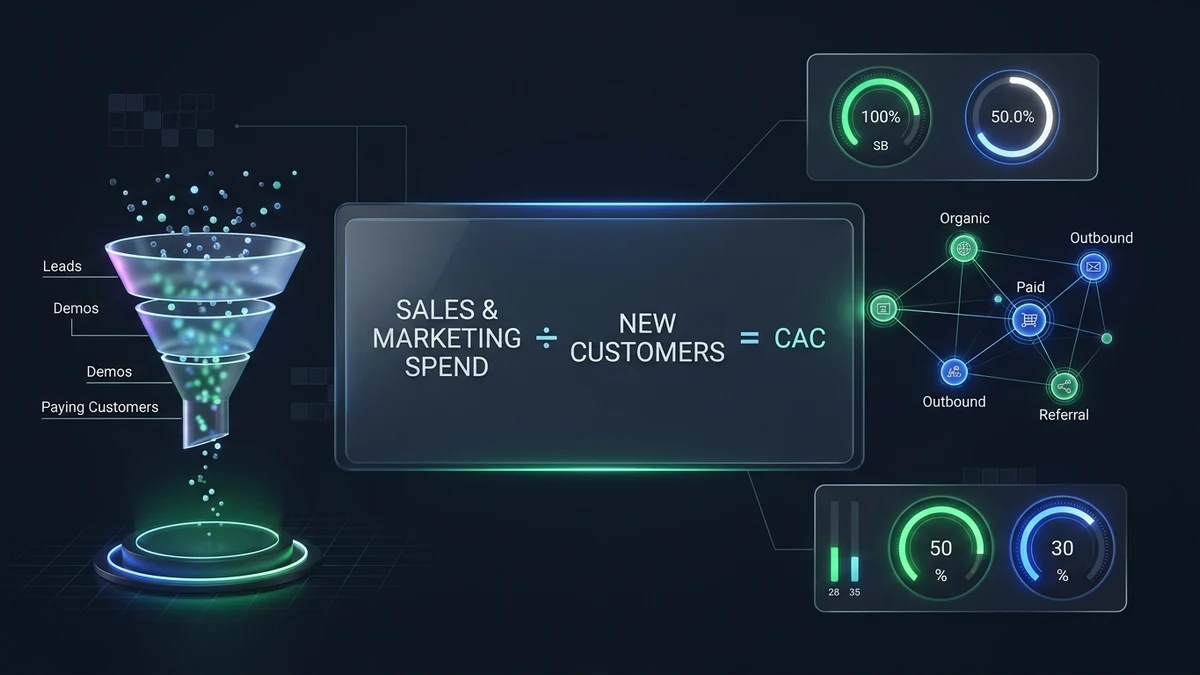
Two SaaS companies can charge the exact same monthly subscription price, acquire customers at the same cost, and report similar monthly recurring revenue (MRR)—yet operate on completely different economic foundations. The defining factor is customer retention.
If one software enterprise retains its customer base for years while a competitor loses accounts after three or four billing cycles, the cumulative gross profit generated by each customer relationship will diverge dramatically. That is why engineering leaders, founders, and finance teams must master Customer Lifetime Value (LTV).
LTV models the total economic value a customer generates over the entire lifespan of the account, rather than merely the revenue collected on initial conversion. However, LTV is not a directly observed empirical fact—it is a mathematical projection built from recurring revenue, service delivery margins, churn curves, and assumptions about future customer behavior.
This practical guide breaks down how to calculate SaaS LTV, when to use a churn-based shortcut versus empirical cohort modeling, how to evaluate LTV alongside Customer Acquisition Cost (CAC), and which diagnostic pitfalls artificially inflate perceived customer value.

1. What Is SaaS Customer Lifetime Value (LTV)?
Customer Lifetime Value (variously abbreviated as LTV, CLV, or CLTV) estimates the total economic return a business expects to realize from a customer account across the entire duration of the relationship.
In subscription software, there are three distinct variations of the metric:
- Revenue LTV: The total gross subscription revenue collected over the account lifespan. While simple to calculate, it completely ignores the operational cost required to deliver the software.
- Gross-Profit LTV: Total revenue minus the direct cost of goods sold (COGS)—including cloud hosting, third-party infrastructure APIs, payment processor fees, and direct customer support. This is the standard metric for acquisition and capitalization decisions.
- Contribution LTV: Gross profit minus additional variable operating costs directly tied to servicing and maintaining the account.
Relying on revenue-only LTV is a hazardous operational error. If a SaaS product generates $100 per month but expends $30 in database compute, AI API tokens, and support labor, that $30 is not available to repay marketing capital. Evaluating acquisition budgets against top-line revenue overstates justifiable customer acquisition spend by 20% to 40%.
2. The SaaS LTV Formula
For a subscription business operating with stable pricing and predictable churn rates, the standard gross-profit LTV formula is expressed as:
Gross-Profit LTV = (Average Revenue Per Account × Gross Margin %) ÷ Customer Churn RateNote: All inputs must use the exact same time unit. If ARPA is monthly, churn must also be monthly. Synchronizing timeframes prevents catastrophic mathematical distortion.
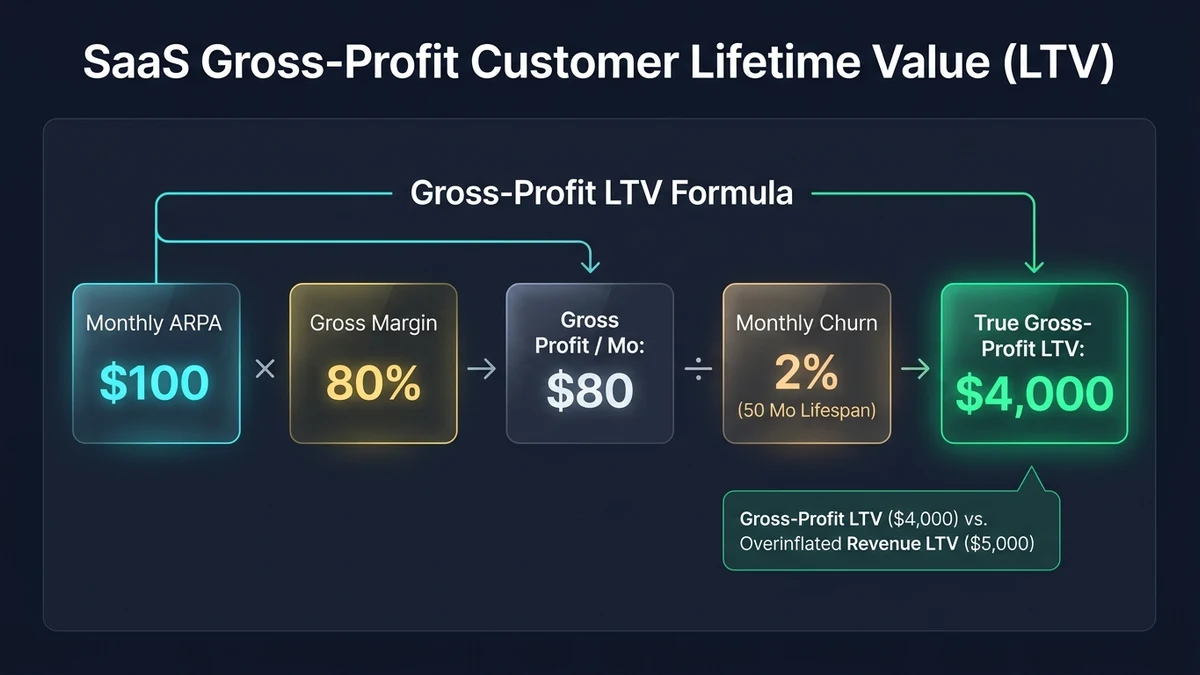
Worked Example:
| Formula Input | Fictional Value | Operational Meaning |
|---|---|---|
| Monthly ARPA | $100.00 | Average monthly recurring revenue per paying account. |
| Gross Margin | 80% (0.80) | Share of revenue surviving hosting, compute, and delivery. |
| Monthly Customer Churn | 2% (0.02) | Proportion of customer accounts terminating each month. |
Calculation:
Step 1: Monthly Gross Profit = $100 × 0.80 = $80.00
Step 2: Expected Lifetime = 1 ÷ 0.02 = 50 Months
Step 3: Estimated LTV = $80.00 ÷ 0.02 = $4,000.00
Under these baseline assumptions, the model estimates $4,000 in lifetime gross profit contribution per customer account. This is an estimate, not a guarantee that every customer will generate $4,000, nor is it cash collected on day one. Cash realization depends on billing cadence, payment processor collections, and ongoing account retention.
3. Understand the Inputs Before Trusting the Result
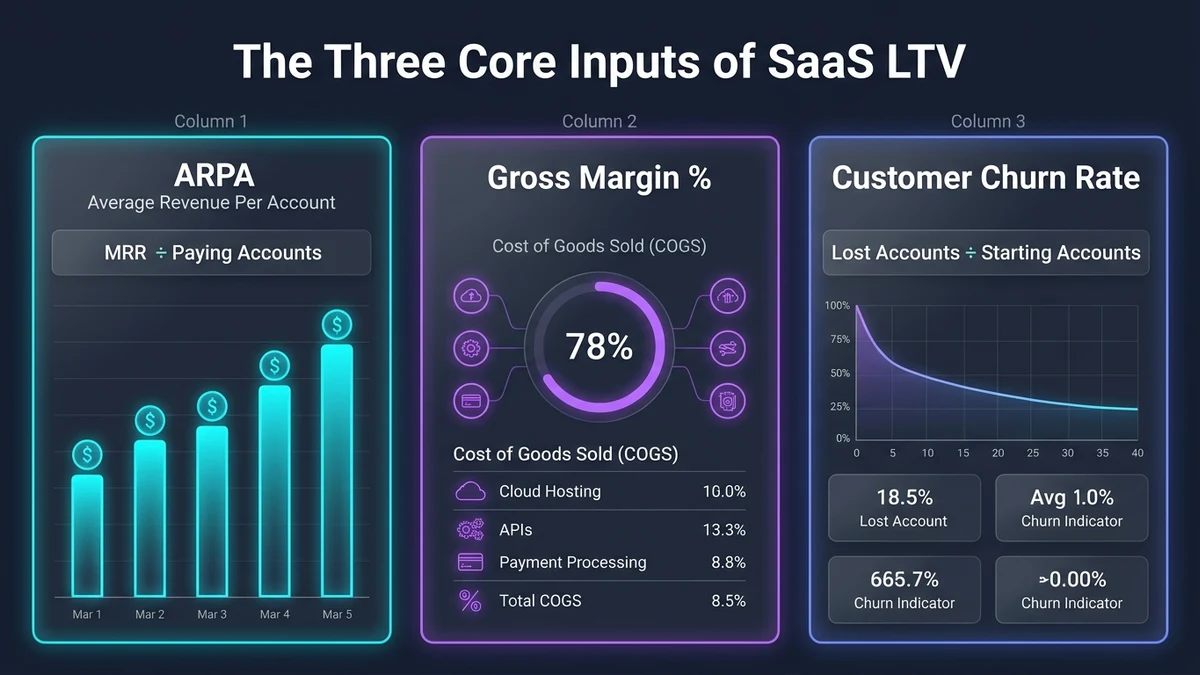
A model is only as dependable as its raw telemetry. Dissecting the three core inputs ensures your calculations reflect financial reality rather than wishful thinking.
Average Revenue Per Account (ARPA)
ARPA equals recurring revenue divided by total active paying accounts during that measurement period. For B2B software, tracking revenue at the account level (ARPA) is generally superior to the user seat level (ARPU) because enterprise customer agreements bundle multiple licenses, seat add-ons, and workspace permissions under a single paying contracting entity.
Illustrative Calculation: A company with $50,000 in monthly recurring revenue across 500 paying customer accounts has a monthly ARPA of $50,000 ÷ 500 = $100.
Gross Margin (Accounting for Direct Delivery COGS)
Gross margin defines the share of recurring revenue remaining after subtracting direct service delivery expenses. For modern cloud platforms, eligible COGS line items include:
- Cloud Infrastructure: Compute clusters, serverless workers, storage, and egress bandwidth. Review our comprehensive breakdown on website infrastructure costs.
- Third-Party Application APIs: LLM inference endpoints, email delivery services (SendGrid/Resend), and authentication providers.
- Payment Gateway Fees: Merchant interchange rates and transaction fees. Read our implementation guide on how to integrate payment system in website.
- Customer Support Labor: Tier-1 and Tier-2 technical support personnel dedicated to keeping active accounts operational.
If customer subscription billing totals $100 and direct hosting, API, and payment costs total $20, the gross profit is $80, yielding an 80% gross margin.
Customer Churn Rate (Logo Churn vs. Revenue Churn)
Customer churn measures the proportion of customer accounts that cancel during a period:
Customer Churn Rate = Customer Accounts Lost in Period ÷ Customer Accounts at Start of PeriodCrucial Distinction: Logo churn tracks customer accounts, while revenue churn measures net recurring dollar volume lost through cancellations and plan downgrades. In simplified account-level LTV models, always pair logo churn with account-level ARPA. When modeling expansion and contraction, transition to cohort revenue retention curves.
4. Three Ways to Calculate SaaS LTV
Method 1: Average Customer Lifetime Method
If a business has years of operational history with verified customer tenure data, it can calculate gross-profit LTV by multiplying gross profit per month by the historically observed average lifetime:
Gross-Profit LTV = Monthly ARPA × Gross Margin % × Average Customer Lifetime (Months)Worked Example: Monthly ARPA of $120, 75% gross margin, and an observed average lifetime of 24 months yields: $120 × 0.75 × 24 = $2,160 LTV. While straightforward, this method requires mature customer cohorts and becomes unreliable when applied to early-stage startups.
Method 2: Churn-Based Shortcut Method
The churn-based shortcut models average customer lifetime as the mathematical inverse of customer churn: Average Lifetime = 1 ÷ Churn Rate.
At a 2% monthly churn rate, the implied lifetime is 1 ÷ 0.02 = 50 months. Multiplying 50 months by $80 monthly gross profit yields $4,000 LTV. While fast, this shortcut assumes churn is uniform over time. In reality, customer churn is rarely linear—most SaaS products experience steep churn in months 1 to 3 followed by a stable, sticky core.
Method 3: Cohort-Based LTV (Empirical Gold Standard)
Cohort analysis tracks a specific group of customers acquired in the same calendar month and measures the actual gross profit generated by that exact cohort as time elapses.
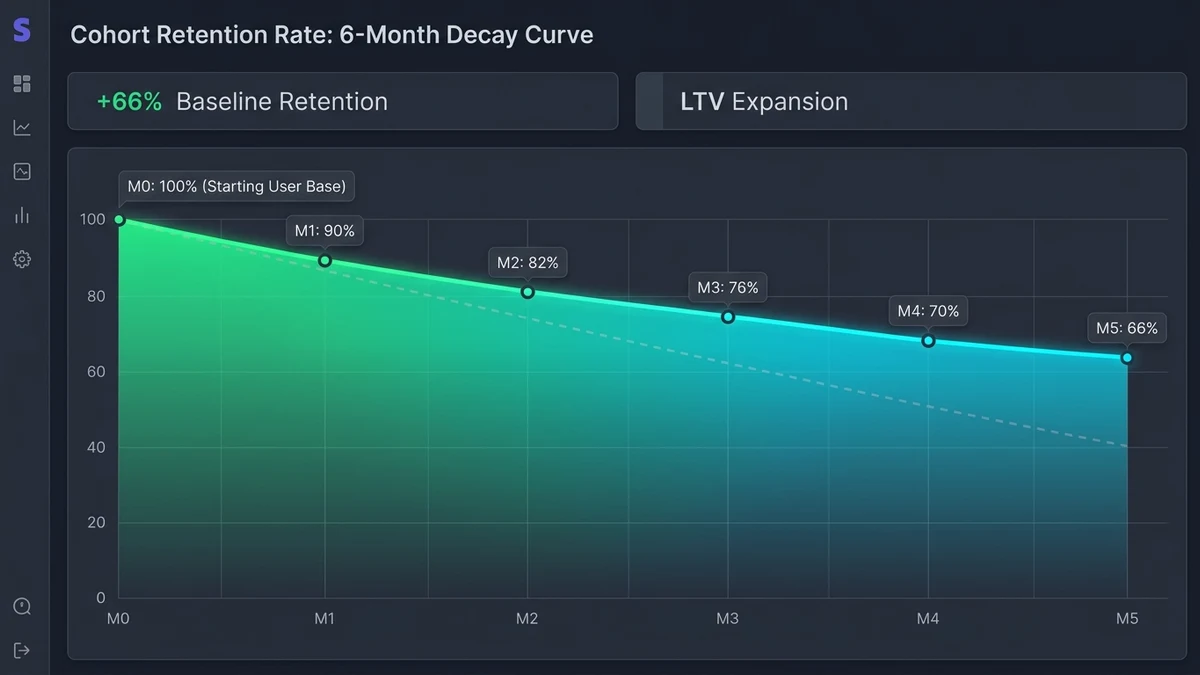
Consider this illustrative 6-month retention curve for a cohort of 100 customer signups:
| Elapsed Month | Active Customers | Cohort Retention % | Active Customer-Months |
|---|---|---|---|
| Month 0 (Signup) | 100 | 100% | 1.00 |
| Month 1 | 90 | 90% | 0.90 |
| Month 2 | 82 | 82% | 0.82 |
| Month 3 | 76 | 76% | 0.76 |
| Month 4 | 70 | 70% | 0.70 |
| Month 5 | 66 | 66% | 0.66 |
| 6-Month Total | — | — | 4.84 Active Months / Account |
By summing the retention proportions, the original cohort delivered 4.84 cumulative customer-months across its first half-year. At $120 monthly gross profit, the cohort has already realized 4.84 × $120 = $580.80 in gross profit per account, allowing leadership to measure empirical cash recovery velocity.
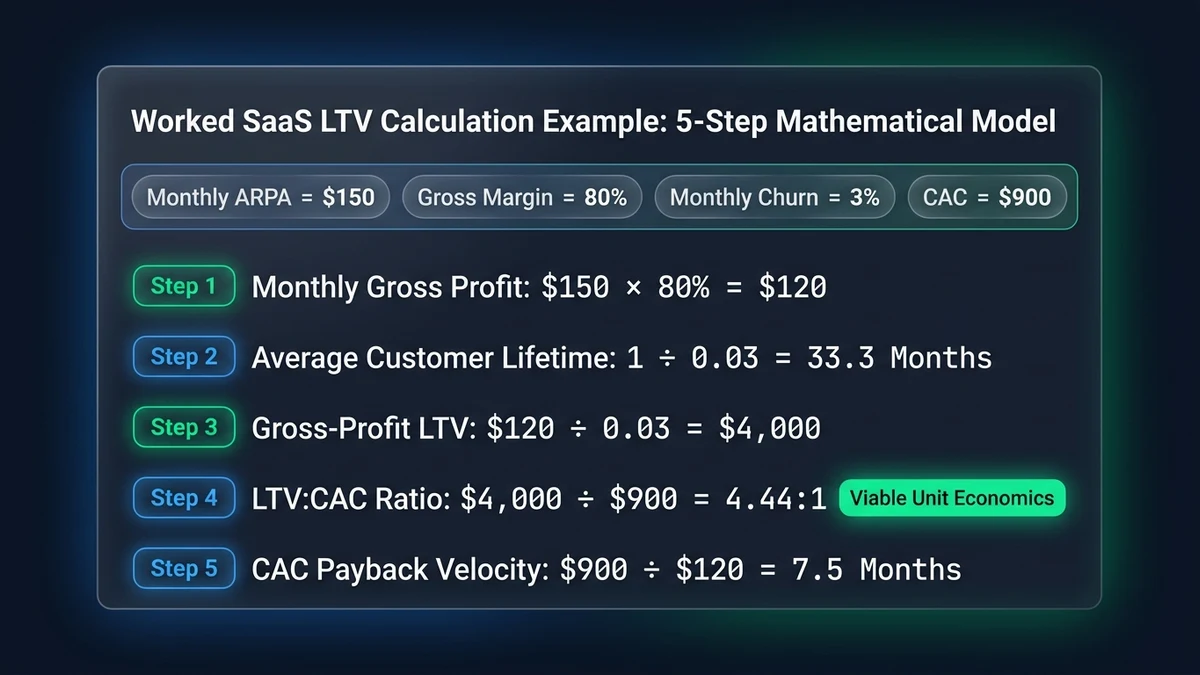
5. Worked Example: Calculate and Interpret SaaS LTV
Consider an illustrative B2B SaaS platform operating with stable monthly operational metrics:
| Operational Input | Illustrative Value |
|---|---|
| Monthly ARPA | $150.00 |
| Gross Margin % | 80% (0.80) |
| Monthly Customer Churn | 3% (0.03) |
| Fully Loaded CAC | $900.00 |
Step-by-Step Mathematical Derivation
- Step 1: Calculate Monthly Gross Profit per Account:
$150 ARPA × 80% Gross Margin = $120.00 Monthly Gross Profit Contribution - Step 2: Estimate Average Customer Lifespan:
1 ÷ 0.03 Monthly Churn = 33.33 Months Expected Lifetime - Step 3: Calculate Gross-Profit LTV:
$120 Monthly Contribution ÷ 0.03 Churn = $4,000.00 Estimated LTV - Step 4: Benchmark Against Customer Acquisition Cost (CAC):
$4,000 LTV ÷ $900 CAC = 4.44:1 LTV:CAC Ratio - Step 5: Calculate Cash Payback Period:
$900 CAC ÷ $120 Monthly Gross Profit = 7.5 Months Payback
Strategic Interpretation: The model projects $4,000 in gross profit return for every $900 deployed into customer acquisition—a healthy 4.44:1 return. Crucially, recovering that $900 outlay takes 7.5 months of uninterrupted billing. If an account churns at month 4, the company suffers a net capital loss despite the attractive 4.44:1 model.
6. What Is a Good LTV:CAC Ratio?
While a 3:1 ratio is frequently cited as a standard planning reference for mature SaaS businesses, it is not an immutable law. Ratios must be evaluated alongside payback velocity, contract duration, and gross margins:
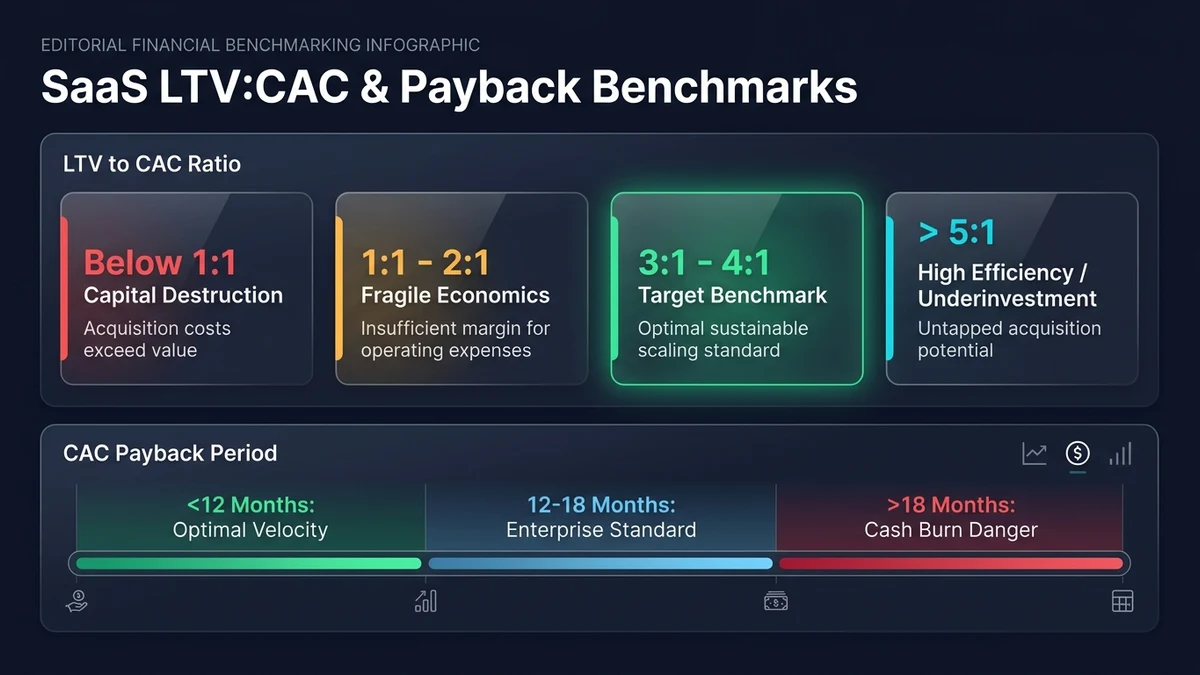
| LTV:CAC Ratio Tier | Diagnostic Health Assessment | Recommended Executive Action |
|---|---|---|
| Below 1:1 | Capital Destructive: Customers cost more than they ever return. | Halt paid acquisition immediately; re-examine onboarding, pricing, and product-market fit. |
| 1:1 to 2:1 | Fragile Economics: Insufficient gross profit to cover R&D and overhead. | Increase pricing tiers, trim acquisition waste, and audit hosting infrastructure. |
| 3:1 to 4:1 | Healthy Planning Benchmark: Sustainable growth equilibrium. | Maintain channel balance; scale sales pipeline while monitoring cohort retention. |
| Above 5:1 | High Efficiency or Under-Investment: Potential to capture more market share. | Deploy capital more aggressively into paid channels and sales capacity before competitors catch up. |
7. Why LTV Estimates Can Be Misleading
A mathematical formula creates the illusion of certainty. Beware these common diagnostic errors:
- Using Top-Line Revenue Instead of Gross Profit: Overstates customer value by 15% to 35% by ignoring hosting, compute, and support delivery costs.
- Assuming Constant Churn Rates: Churn rates change dynamically as companies scale into new customer segments or encounter product competitors.
- Extrapolating Short Observation Windows: Using three months of data to project a 4-year customer lifespan creates massive compounding forecast errors.
- Blending Divergent Customer Segments: Lumping $20/month self-serve users with $2,000/month enterprise contracts distorts averages for both cohorts.
- Ignoring Payment Gateway Failures: Involuntary churn (expired credit cards, processor rejections) accounts for up to 40% of subscription attrition. Implement dunning tools and webhook listeners to protect realized LTV.
- Counting Immature Cohorts as Realized Fact: Forecasted future retention must be clearly demarcated from empirically observed historical retention.
8. How to Improve LTV Through Retention and Experience
Increasing Customer Lifetime Value requires a systematic focus on customer success, activation velocity, and product reliability:
- Accelerate First-Session Activation: Guide users to their primary "aha moment" within minutes of account creation to establish immediate perceived value.
- Strengthen In-App Onboarding: Streamline workspace invitations, third-party integrations, and API provisioning to reduce setup friction.
- Deploy Predictive Telemetry: Instrument telemetry to detect accounts exhibiting drop-offs in daily active usage before they submit cancellation requests.
- Improve Infrastructure Reliability: Maintain high uptime, optimize API latencies, and eliminate slow page transitions that frustrate enterprise power users.
- Align Pricing with Value Expansion: Structure pricing tiers so expanding accounts naturally upgrade into higher capacity, feature, or user tiers.
- Analyze Churn by Acquisition Channel: Review exit surveys and cohort data to identify which marketing channels deliver sticky customers versus high-churn bargain hunters.
9. Interactive SaaS LTV Calculator
Use this engineering calculator to model your customer economics. Compare the simplified churn shortcut against empirical cohort retention, benchmark your LTV:CAC ratio, and calculate your exact cash payback timeline in real time.
SaaS Customer Lifetime Value (LTV) Calculator
Model Input Parameters
Calculates gross-profit-adjusted LTV based on recurring revenue and churn rate.
MRR divided by total paying accounts (e.g., $150).
Used to benchmark your LTV:CAC ratio and cash payback velocity.
Ignoring COGS inflates customer value by $1,000, risking fatal overspending on customer acquisition.
10. Practical SaaS LTV Executive Reporting Dashboard
Leadership teams should establish a repeatable monthly review cadence using this structured reporting telemetry:
| Executive Telemetry Metric | Strategic Decision Significance |
|---|---|
| Gross-Profit LTV | The true ceiling for sustainable, fully loaded customer acquisition capital. |
| Revenue LTV | Indicates gross contract volume; useful for top-line revenue capacity planning. |
| Logo Churn Rate % | Measures account retention health; early warning indicator of product friction. |
| Net Revenue Retention (NRR) | Includes expansion revenue, downgrades, and churn. Above 100% indicates compounding organic expansion. |
| LTV:CAC Ratio | Quantifies capital efficiency. Target 3:1+ for sustainable venture or bootstrapped growth. |
| CAC Payback Period (Months) | Dictates working capital velocity and cash runway requirements (<12 months recommended). |
| Cohort Retention Curves | Validates whether new product updates and marketing channels improve long-term retention over time. |
Conclusion: Treat LTV as an Estimate That Improves With Better Retention Data
Customer Lifetime Value provides founders and technical leaders with the financial visibility needed to build durable, scalable software businesses. The simplified ARPA, gross margin, and churn formula offers a helpful starting point, but it must always be treated as an estimate built on visible operational assumptions.
As customer volume expands, move beyond a single blended number. Track empirical customer cohorts, isolate performance across acquisition channels, and evaluate LTV in tandem with CAC payback velocity and gross margin. The objective is not to produce the largest theoretical LTV on paper, but to build an engineering and customer success engine that delivers lasting value to the right customers sustainably.
Sources and Further Reading
- American Marketing Association – Customer Lifetime Value Toolkits & Benchmarks
- ChartMogul – Subscription Analytics & SaaS Metrics Platform
- ChartMogul Guide – Calculating CAC Payback Velocity
- L.E.K. Consulting – SaaS Enterprise Metrics & Unit Economics Report
- Stripe Resources – Essential SaaS Metrics for Founders