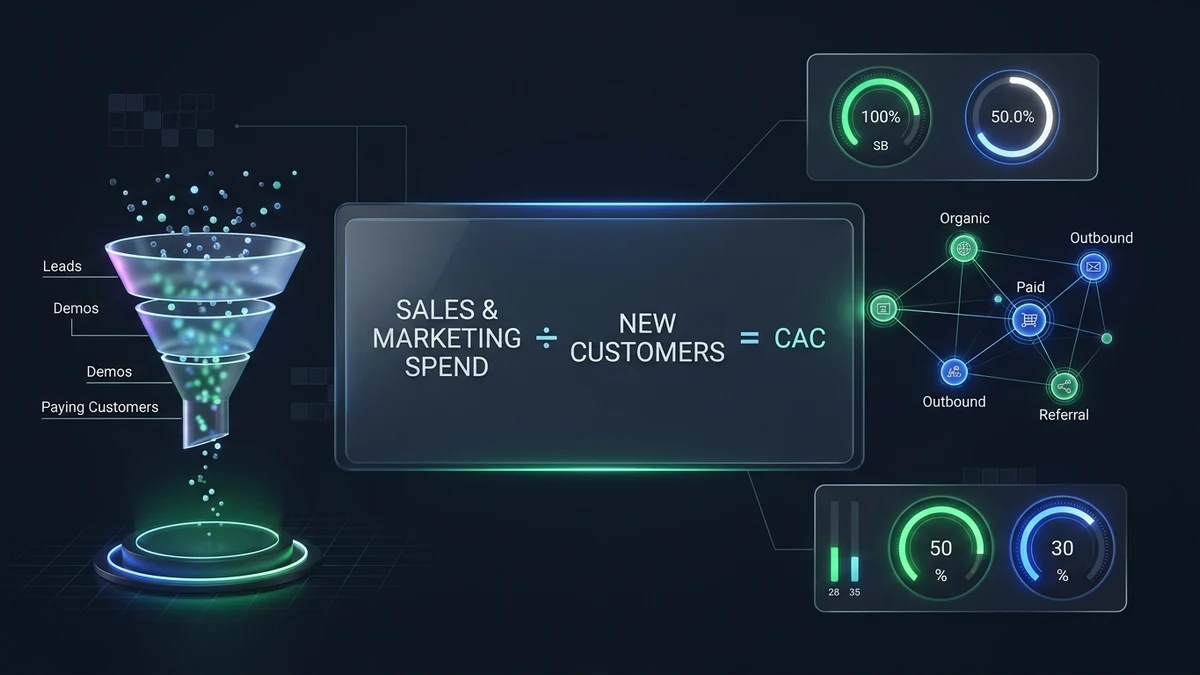
A SaaS business can add new customers every month, increase monthly recurring revenue (MRR), and still lose money on every customer it acquires. The underlying reason is straightforward: revenue growth does not automatically mean profitable growth.
SaaS unit economics help founders and engineering leaders understand whether the revenue generated by an individual customer relationship can justify the capital expended to acquire and serve that customer. They synthesize four critical operational pillars: Customer Acquisition Cost (CAC), Customer Lifetime Value (LTV), Average Revenue Per User (ARPU), and Gross Margin.
When evaluated together rather than in isolation, these metrics answer fundamental strategic questions:
- How much capital can you responsibly afford to spend to win a single customer?
- How many months of gross profit contribution are required to recover that acquisition cash?
- Are accounts retaining long enough to cross the threshold into net profitability?
- Does scaling customer volume expand your margins through operational leverage, or dilute them through rising support and hosting overhead?
This guide provides a comprehensive technical breakdown of each metric, outlines the mathematical formulas, highlights common diagnostic traps, and walks through a worked financial model you can apply directly to your SaaS architecture.

What Are SaaS Unit Economics?
SaaS unit economics measure the revenue, direct delivery expenses, and acquisition capital associated with a discrete, clearly defined unit of business—typically one customer, one subscription account, or one contract. Rather than examining aggregate top-line revenue, unit economics evaluate whether the individual customer unit generates enough gross profit contribution to cover the cost of customer acquisition.
Defining the "unit" with absolute consistency is essential. For per-seat productivity tools, teams must analyze both per-user and per-organization metrics. For modern API-driven or usage-based cloud platforms, economics must be evaluated across consumption tiers or customer cohorts. Conflating different units inevitably masks unprofitable customer segments.
At its core, customer-level economics connects three foundational inquiries:
- Acquisition: What is the fully loaded cost to convert a prospect into a paying customer?
- Value: How much cumulative gross profit is that customer expected to produce across the lifespan of the account?
- Delivery: What ongoing infrastructure, third-party software, and support costs are required to fulfill the service?
While the ratio of LTV to CAC provides a helpful snapshot, it must never be examined in a vacuum. Gross margin, churn trajectory, and the cash payback period dictate whether expansion is capital-efficient or headed toward cash exhaustion.
1. Customer Acquisition Cost (CAC)
Customer Acquisition Cost represents the average capital spent to secure one new paying customer during a specified reporting window. It encompasses the complete sales and marketing infrastructure required to generate demand, nurture leads, and close contracts—not merely direct advertising spend.
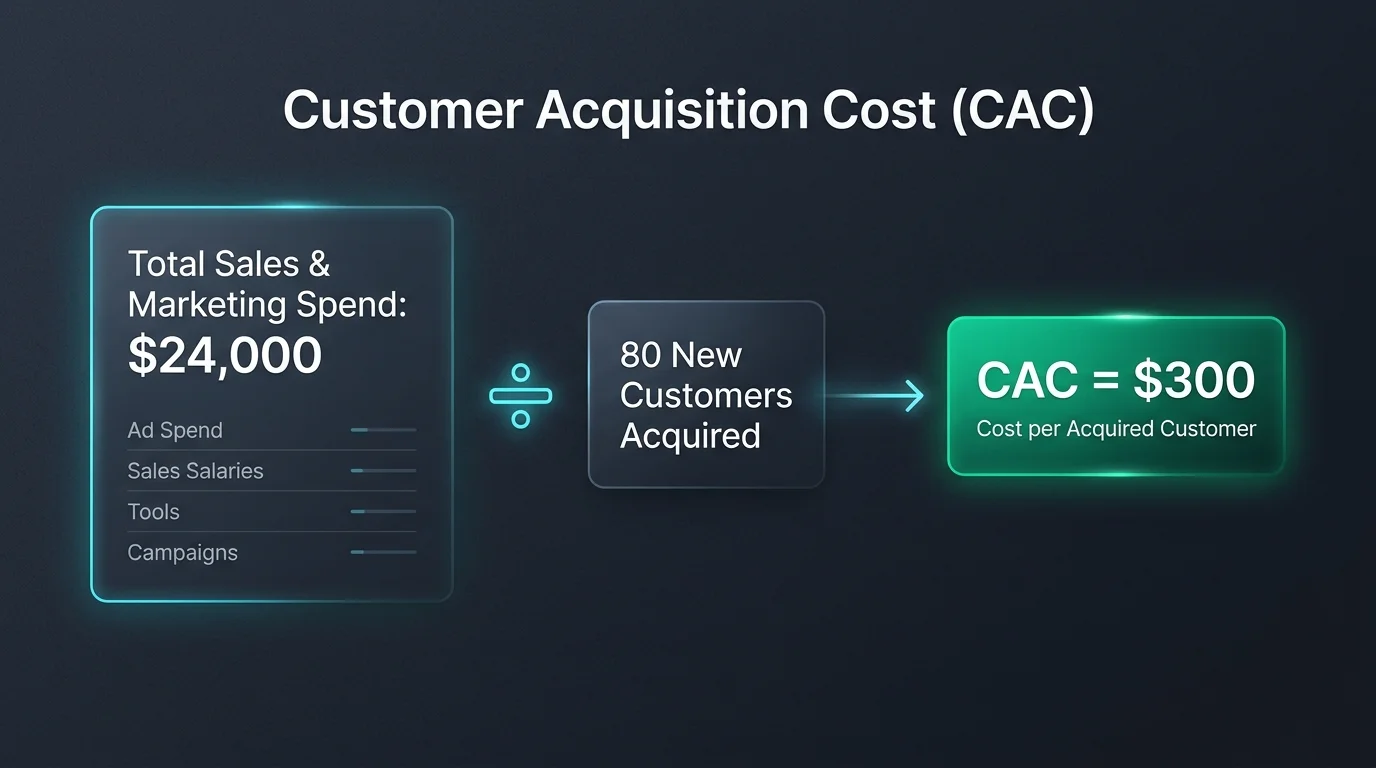
The Basic CAC Formula
CAC = Total Sales & Marketing Acquisition Costs ÷ Number of New Paying Customers AcquiredWorked Example: Suppose a B2B SaaS platform incurs $24,000 in quarterly sales and marketing expenses and closes 80 new paying customer subscriptions during that quarter:
$24,000 ÷ 80 = $300 CACThe business spent an average of $300 to win each new paying customer.
What Belongs in Fully Loaded CAC?
- Paid Media: Search ads, social campaigns, retargeting, and sponsored editorial placements.
- Team Compensation: Salaries, commissions, and bonuses for sales reps (SDRs/AEs), growth marketers, and copywriters.
- Tooling & Infrastructure: CRM platforms (HubSpot/Salesforce), email automation, lead enrichment, and sales intelligence tools.
- Agency & Creative Fees: SEO retainers, freelance design, video production, and content syndication.
Common CAC Diagnostic Pitfalls
- Counting Free Trials: Dividing spend by free signups or MQLs instead of completed paying conversions drastically underestimates true acquisition costs.
- Blending Unrelated Cohorts: Grouping self-serve SMB signups with enterprise contracts distorts payback analysis. Always segment CAC by marketing channel and tier.
- Sales Cycle Mismatches: If your enterprise sales cycle averages 90 days, marketing dollars spent in Q1 produce conversions in Q2. Lagging spend against conversion cohorts prevents distorted spikes.
2. Customer Lifetime Value (LTV)
Customer Lifetime Value models the total gross profit contribution an account will generate before terminating the subscription. In software economics, evaluating LTV strictly on top-line revenue is a hazardous mistake; a gross-margin-adjusted LTV is mandatory because it accounts for the ongoing cost of delivering the software.
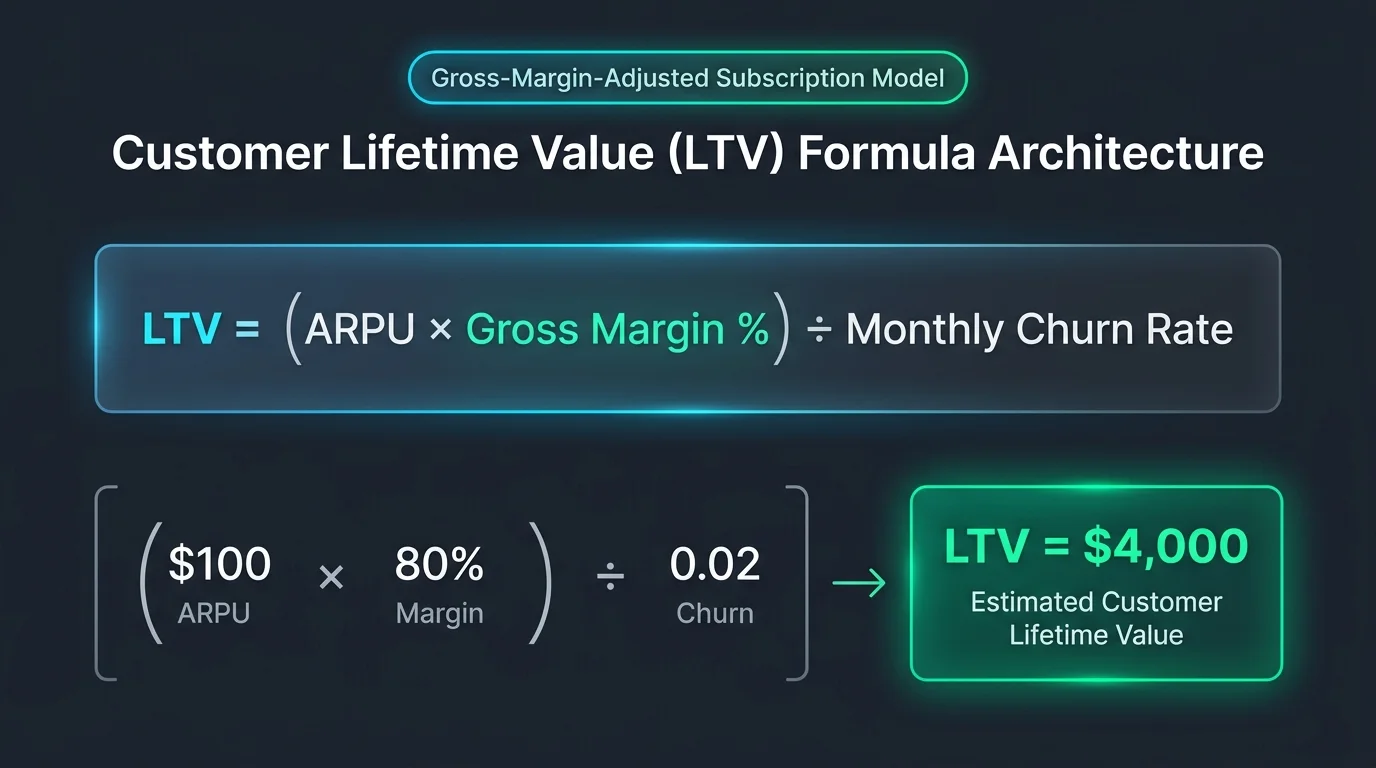
The Gross-Margin-Adjusted LTV Formula
LTV = (ARPU × Gross Margin %) ÷ Monthly Customer Churn RateNote: Monthly customer churn must be represented as a decimal (e.g., 2% churn = 0.02).
Worked Example: A SaaS subscription charges an average of $100 per customer each month, operates at an 80% gross margin, and experiences a steady 2% monthly customer churn rate:
($100 × 0.80) ÷ 0.02 = $80 ÷ 0.02 = $4,000 Estimated LTVThe model estimates $4,000 in cumulative gross profit contribution over the average customer lifespan.
3. Average Revenue Per User (ARPU)
Average Revenue Per User measures the normalized recurring revenue generated by each customer unit over a defined period (usually monthly). When individual accounts bundle dozens of team seats, companies track Average Revenue Per Account (ARPA) instead.
Monthly ARPU = Monthly Recurring Revenue (MRR) ÷ Average Number of Paying UsersWorked Example: If your web application generates $50,000 in MRR across 1,000 active paying users, monthly ARPU is exactly $50.
| Metric | Measures | Optimal Use Case |
|---|---|---|
| ARPU (User) | Revenue per individual seat | B2C SaaS, consumer apps, or strictly per-seat B2B licensing |
| ARPA (Account) | Revenue per commercial contract | B2B enterprise platforms where accounts have multi-tier seat tiers |
ARPU serves as a direct barometer of product monetization. It expands when accounts upgrade plans, unlock premium add-ons, or consume more API compute. Conversely, it contracts when aggressive discounting occurs or when lower-priced entry tiers dilute the customer mix.
4. Gross Margin
Gross margin is the percentage of total revenue remaining after deducting the direct costs incurred to deliver and operate the software service (Cost of Goods Sold / COGS). In cloud software, direct delivery costs include cloud hosting (AWS/Cloudflare/GCP), external API endpoints, payment processor interchange, and customer support.
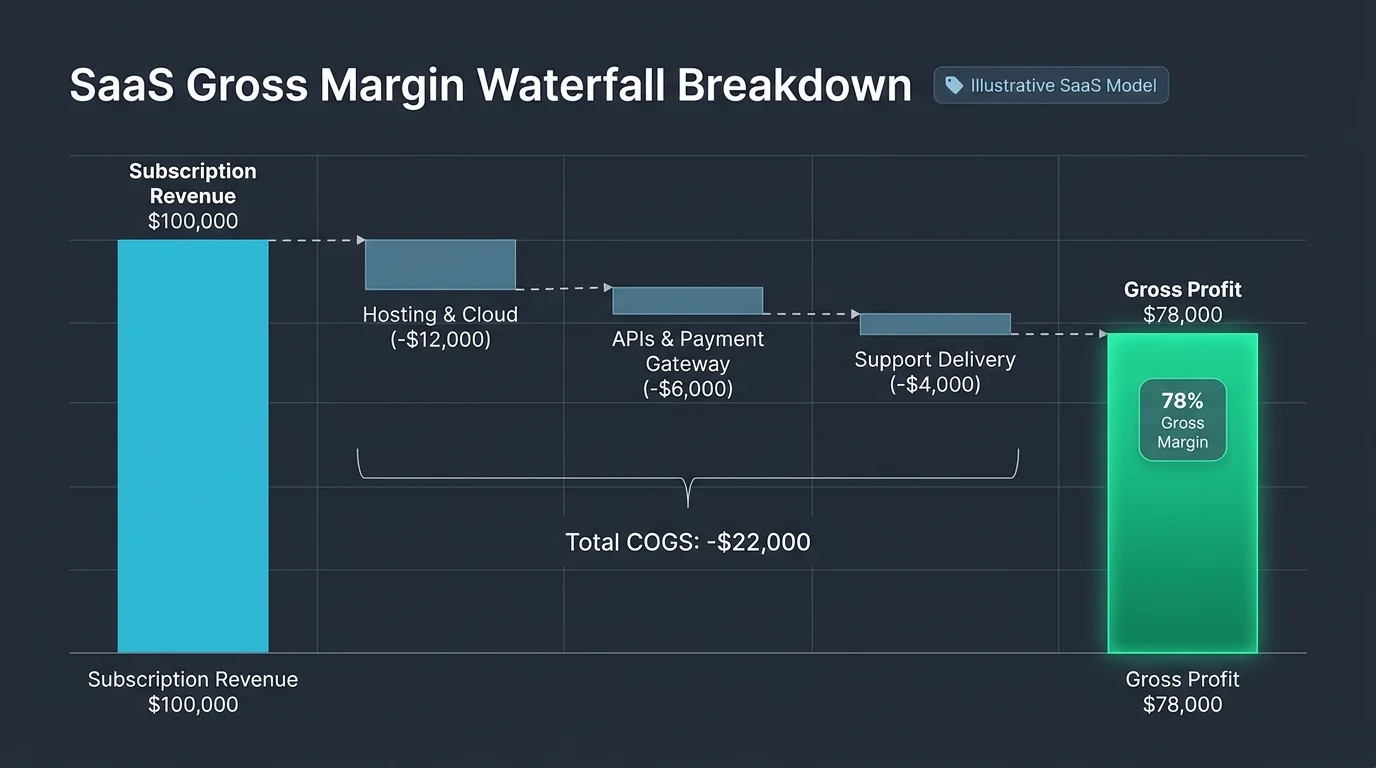
The Gross Margin Formula
Gross Margin % = ((Revenue − Cost of Revenue) ÷ Revenue) × 100Worked Example: A SaaS business produces $100,000 in monthly subscription billing while incurring $22,000 in direct delivery costs (cloud servers, data storage, payment gateways, and tier-one customer support):
(($100,000 − $22,000) ÷ $100,000) × 100 = 78% Gross MarginThe business retains $0.78 of every top-line revenue dollar to cover customer acquisition, R&D engineering salaries, administrative overhead, and net operating profit.
How CAC, LTV, ARPU, and Gross Margin Work Together
These metrics only become strategically actionable when synthesized into a unified operational model:
| Metric | Core Question Answered | Strategic Value |
|---|---|---|
| CAC | What did it cost to win this customer? | Evaluates sales & marketing channel efficiency |
| ARPU | How much monthly recurring revenue does each user yield? | Measures pricing power and tier monetization |
| Gross Margin | What percentage of revenue survives direct delivery costs? | Quantifies software scalability and COGS control |
| LTV | How much cumulative gross profit will the account generate? | Establishes the ceiling for justifiable customer acquisition |
| LTV:CAC | Does the lifetime value sufficiently exceed the cost to acquire? | Connects expected return with capital investment |
| CAC Payback | How many months until customer gross profit repays CAC? | Dictates working capital cash flow and balance sheet runway |
Worked Example: Calculate SaaS Unit Economics
Consider an illustrative B2B SaaS platform operating with stable monthly performance metrics:
| Model Parameter | Illustrative Value |
|---|---|
| Monthly ARPU | $120 |
| Gross Margin % | 80% |
| Monthly Customer Churn | 2% (0.02) |
| Fully Loaded CAC | $1,500 |
Step-by-Step Mathematical Walkthrough
- Step 1: Monthly Gross Profit Contribution:
$120 ARPU × 80% Gross Margin = $96 Gross Profit / Customer / Month - Step 2: Estimated Customer Lifetime Value (LTV):
$96 Monthly Contribution ÷ 0.02 Churn = $4,800 LTV - Step 3: LTV:CAC Ratio:
$4,800 LTV ÷ $1,500 CAC = 3.2:1 Ratio - Step 4: CAC Payback Period:
$1,500 CAC ÷ $96 Monthly Gross Profit = 15.6 Months
Strategic Interpretation: For every $1,500 deployed into customer acquisition, the company projects $4,800 in lifetime gross profit contribution—an attractive 3.2:1 return profile. However, recovering that initial $1,500 outlay requires 15.6 months of uninterrupted subscription billing. If customer churn spikes during month 8, the account terminates at a net capital loss.
What Is a Healthy LTV:CAC Ratio?
While a 3:1 ratio is widely recognized as a standard planning benchmark for mature venture-backed SaaS companies, acceptable ranges depend on gross margin and customer contract size:
| LTV:CAC Range | Business Health Diagnostics | Recommended Operational Action |
|---|---|---|
| Below 1:1 | Severe capital destruction; customers cost more than they generate | Halt paid acquisition immediately; re-examine pricing, retention, and onboarding |
| 1:1 to 2:1 | Fragile economics; insufficient gross profit to cover R&D and operational overhead | Increase pricing tiers, trim acquisition waste, and audit hosting infrastructure |
| 3:1 to 4:1 | Healthy, sustainable growth equilibrium for scaling software businesses | Maintain channel balance; scale sales pipeline while monitoring cohort churn |
| Above 5:1 | Exceptional unit efficiency—or sign of under-investing in marketing expansion | Deploy capital more aggressively into paid channels and sales capacity |
CAC Payback Period: The Missing Cash-Flow Metric
A favorable 4:1 LTV:CAC ratio can still result in bankruptcy if the cash payback takes 36 months and you exhaust your cash reserves waiting for accounts to turn cash-flow positive. The CAC payback period determines your cash conversion velocity.
CAC Payback (Months) = CAC ÷ (Monthly ARPU × Gross Margin %)For self-serve SMB SaaS products, target a payback between 6 and 12 months. For mid-market and enterprise B2B applications with annual upfront billing or multi-year commitments, payback periods between 12 and 18 months are structurally sustainable.
Common Mistakes That Distort SaaS Unit Economics
- Using Top-Line Revenue in LTV: Calculating LTV without adjusting for gross margin overstates customer profitability by 20% to 30%. Always use gross-profit-adjusted LTV.
- Misaligned Timeframes: Multiplying monthly ARPU by annual churn rates yields mathematically invalid numbers. Keep periods synchronized (monthly with monthly, annual with annual).
- Excluding Customer Success Salaries: Customer onboarding, ongoing technical support, and account management are direct costs of delivery (COGS). Excluding them artificially inflates gross margin.
- Treating Modeled LTV as Guaranteed Fact: LTV is a mathematical projection. Validate your formula against rolling 12-month cohort retention tables to confirm actual realization.
- Ignoring Involuntary Churn: Expired credit cards and payment gateway failures represent up to 40% of SaaS churn. Implement automated dunning and webhooks to prevent margin leakage.
A Practical Monthly Unit Economics Review
Founders and finance teams should establish a repeatable monthly unit cadence to detect margin decay before it impacts the balance sheet:
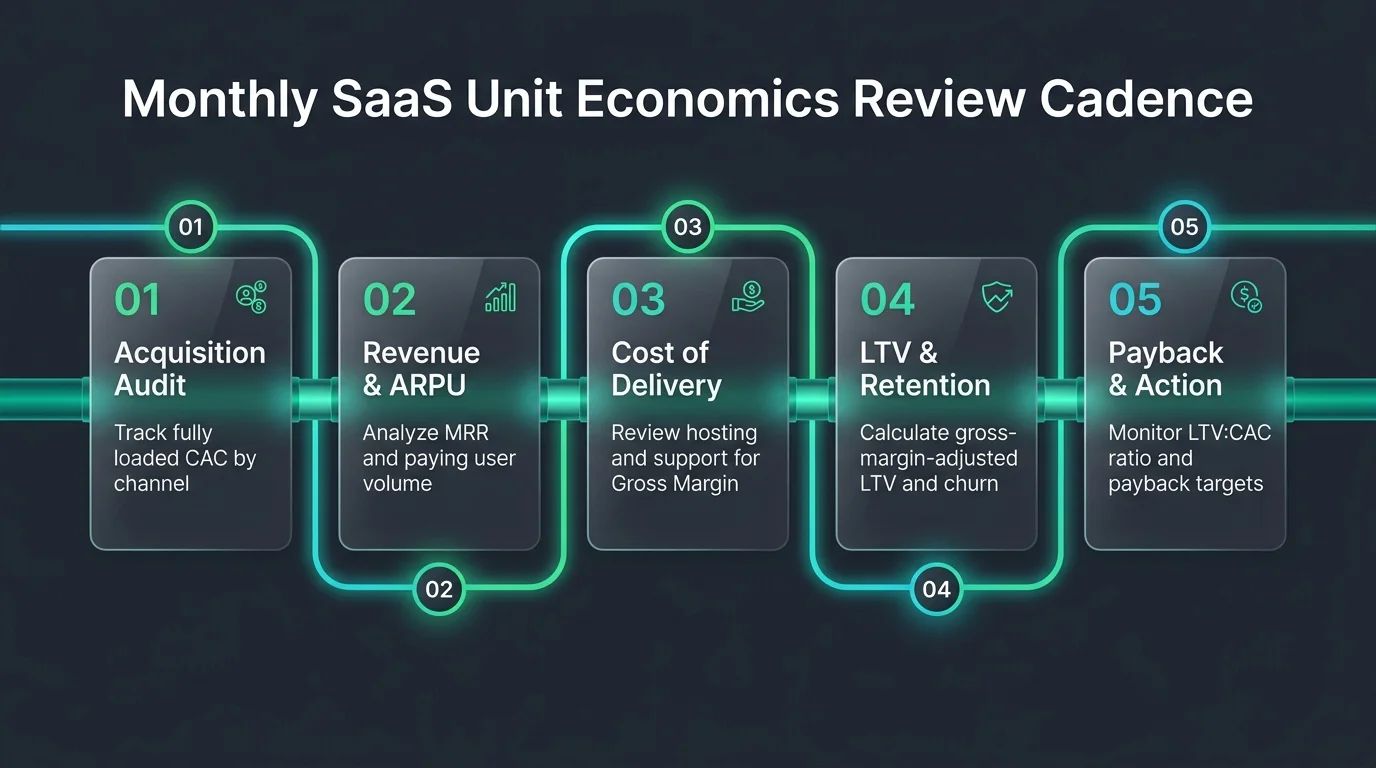
- 1. Acquisition Audit: Track fully loaded marketing spend and calculate CAC by acquisition channel (organic, paid search, outbound SDR).
- 2. Revenue & ARPU Alignment: Record active MRR and paying account count; monitor expansion revenue against plan downgrades.
- 3. Cost of Delivery Analysis: Audit hosting bills, third-party API usage fees, and support overhead to track true Gross Margin.
- 4. Retention & Cohort Validation: Calculate gross-margin-adjusted LTV and evaluate against 30/60/90-day cohort retention curves.
- 5. Payback & Action Plan: Evaluate the LTV:CAC ratio and CAC payback months. Assign targeted fixes to any channel showing rising acquisition costs or shortening retention.
Conclusion: Measure Profitable Growth, Not Just Customer Growth
Scaling a SaaS business requires disciplined visibility into what customer acquisition costs and what customer relationships return over time. Top-line vanity metrics—such as total signups or gross booking volume—provide little insight into whether an enterprise is building durable equity or subsidizing unprofitable customer churn.
By pairing Customer Acquisition Cost with gross-margin-adjusted Lifetime Value, monitoring Average Revenue Per User, and maintaining a rapid CAC payback velocity, founders can scale their customer base with confidence that each new account compounds long-term enterprise value.