A Next.js website can have a modern design, clean code, and excellent content but still deliver a frustrating experience if its pages load slowly, respond late to clicks, or shift around while loading.
These problems affect far more than aesthetic appearance. They directly erode user engagement, driving visitors to abandon a page before they have a chance to read your content, complete a purchase, or submit an inquiry form. In an era where user experience signals dictate audience retention, performance is foundational to product engineering.
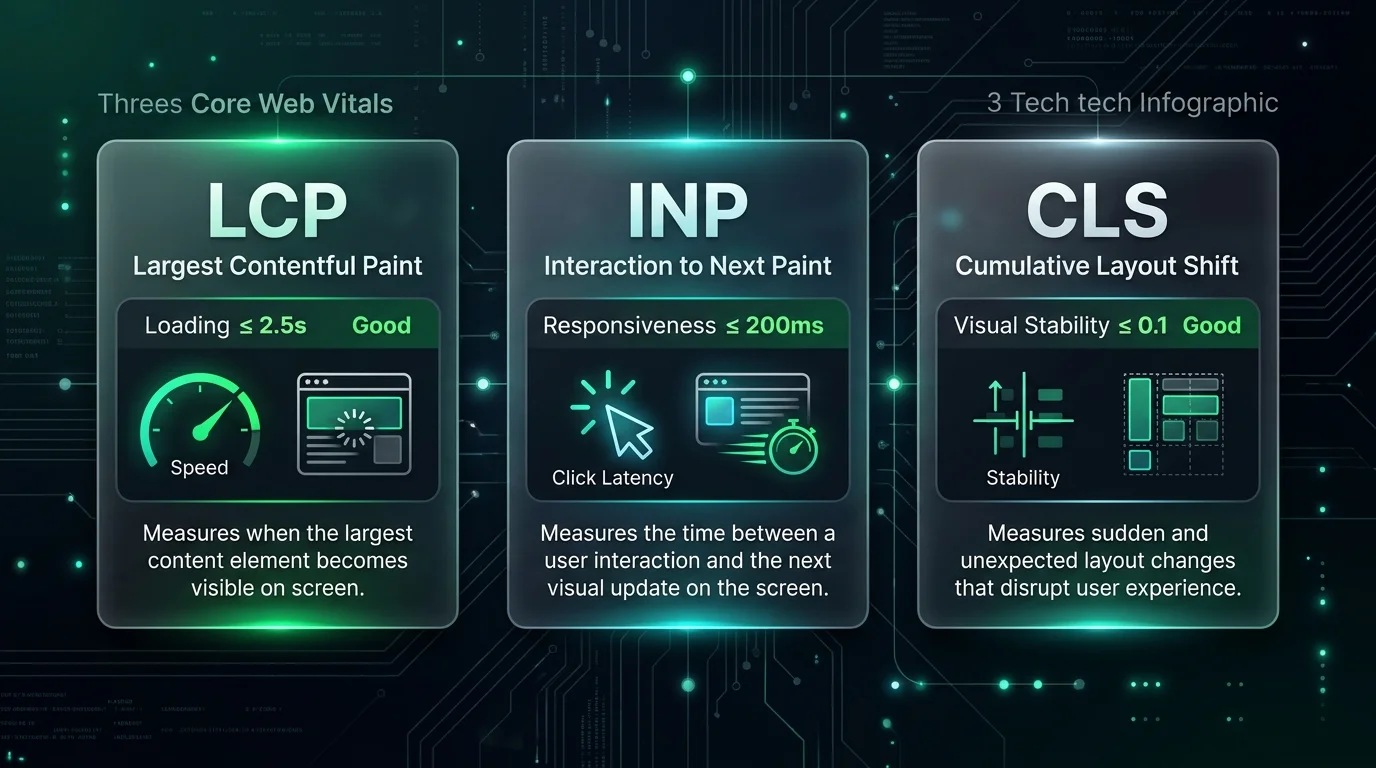
Google's Core Web Vitals provide an objective, real-world framework to evaluate three crucial facets of page experience:
- Loading (LCP): How quickly the page's primary, visible content renders in the viewport.
- Interactivity (INP): How quickly the interface visually reacts to user inputs such as clicks, taps, and keystrokes.
- Visual Stability (CLS): Whether visible elements remain structurally stable without sudden, disruptive movements during render.
For Next.js developers working in the modern App Router paradigm, achieving passing scores requires looking well beyond isolated synthetic Lighthouse audits. Image optimization pipelines, client versus server component boundaries, font loading mechanics, third-party analytics scripts, and edge caching architecture all interact to influence user telemetry.
This guide provides a comprehensive technical walkthrough for measuring, diagnosing, and systematically optimizing Core Web Vitals across production Next.js applications.
What Are Core Web Vitals?
Core Web Vitals represent Google's standardized metrics for user-centric performance, evaluated directly from real-world Chrome telemetry via the Chrome User Experience Report (CrUX). Unlike lab-only tools that simulate synthetic network throttling on high-end hardware, Core Web Vitals assess real visitors across variable cellular networks and varying mobile device chipsets.
The three standardized metrics include:
- Largest Contentful Paint (LCP): Tracks perceived loading speed by recording the exact render timestamp of the largest image, video thumbnail, or text block visible within the initial viewport.
- Interaction to Next Paint (INP): Replaced First Input Delay (FID) as an official Core Web Vital in March 2024. INP assesses full-session interaction responsiveness by measuring the latency between every user click, tap, or key press and the subsequent visual frame presentation on screen.
- Cumulative Layout Shift (CLS): Quantifies visual stability by calculating the sum of all unexpected layout shift scores for every visible element that abruptly shifts coordinate positions during the page lifecycle.
Core Web Vitals Official Thresholds
Google measures compliance at the 75th percentile of page visits, segmented independently between mobile and desktop devices. For an origin or URL to pass, at least 75% of user experiences must hit the "Good" threshold.
| Metric | What It Measures | Good (Pass) | Needs Improvement | Poor (Fail) |
|---|---|---|---|---|
| Largest Contentful Paint (LCP) | Main content render speed | ≤ 2.5 seconds | 2.5s – 4.0s | > 4.0 seconds |
| Interaction to Next Paint (INP) | Interaction responsiveness | ≤ 200 ms | 200 ms – 500 ms | > 500 ms |
| Cumulative Layout Shift (CLS) | Visual stability | ≤ 0.10 | 0.10 – 0.25 | > 0.25 |
Why Core Web Vitals Matter for Next.js Websites
Next.js is engineered with exceptional performance capabilities: automatic server-side rendering, React Server Components (RSC), granular code splitting, the optimized next/image component, and zero-runtime Google Font hosting via next/font.
However, adopting Next.js does not automatically guarantee passing Core Web Vitals. In fact, common architectural anti-patterns frequently introduce performance bottlenecks:
- Oversized Client Bundles: Placing
"use client"at the top of page layouts forces React to hydrate large component subtrees in the browser, hogging the main thread and damaging INP. - Late-Discovered Hero Assets: Wrapping the primary viewport banner image in client-side state or failing to prioritize it prevents the browser's preload scanner from initiating early image downloads.
- Blocking Backend Queries: Using dynamic Server-Side Rendering (SSR) without edge caching forces the browser to stall during Time to First Byte (TTFB), directly inflating LCP.
- Third-Party Tag Congestion: Injecting unoptimized marketing, chat, and tag managers via standard script tags delays execution and creates long JavaScript tasks.
- Unconstrained Media: Omitting height and width constraints or aspect ratios causes layout jumps when images or ads finally resolve, spiking CLS.
1. How to Improve Largest Contentful Paint (LCP) in Next.js
Largest Contentful Paint measures when the single largest visible content element in the above-the-fold viewport finishes rendering. In 80% of web builds, this element is a hero photograph, promotional banner graphic, video poster, or large H1 typography block.
Fix 1: Optimize Images With next/image and Explicit Priority
The built-in Next.js Image component automates responsive scaling, format conversion (AVIF/WebP), and layout containment. However, because next/image defaults to lazy loading, applying it to your primary viewport banner will actually degrade LCP unless you explicitly tell Next.js that this asset is critical.
For above-the-fold hero images, always pass the priority attribute (or preload in modern Next.js releases) and supply accurate responsive sizes:
import Image from "next/image";

export default function HeroSection() {
  return (
    <header className="relative w-full aspect-[16/9] max-w-5xl mx-auto overflow-hidden rounded-2xl">
      <Image
        src="/images/articles/core-web-vitals-nextjs-optimization/featured.webp"
        alt="Core Web Vitals telemetry dashboard for Next.js"
        fill
        priority
        sizes="(max-width: 768px) 100vw, (max-width: 1200px) 90vw, 1200px"
        className="object-cover"
      />
    </header>
  );
}
Key Takeaway: Setting priority injects a high-priority <link rel="preload" as="image"> directive directly into the server-rendered HTML <head>. This allows the browser's speculative preload scanner to fetch the image bytes simultaneously alongside stylesheets, before CSSOM construction completes.
Fix 2: Minimize Time to First Byte (TTFB) Through Caching and SSG
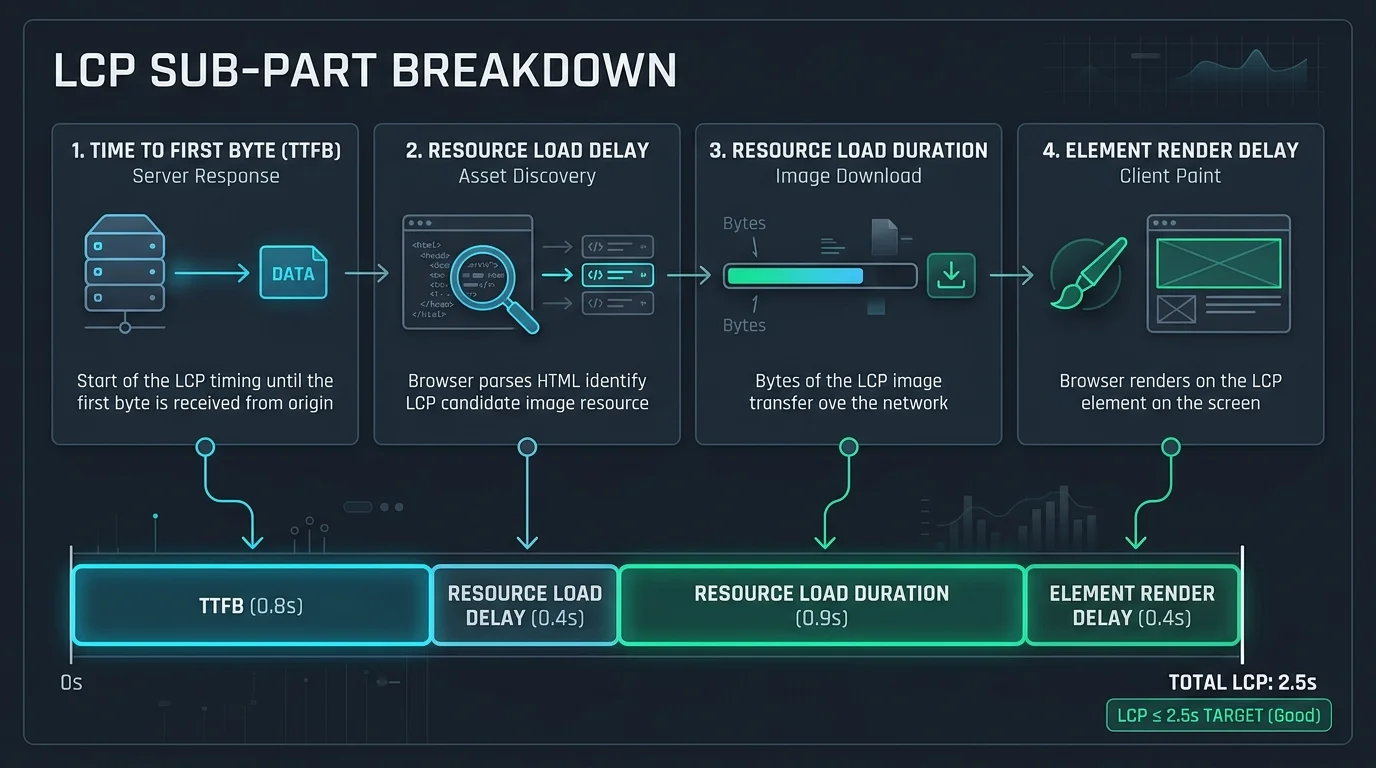
LCP cannot occur until the HTML document arrives. If your server takes 1.8 seconds to query an uncached database and execute server-side rendering, you have only 700 milliseconds left for all subsequent asset downloads, CSS parsing, and painting before violating the 2.5-second threshold.
- Static Site Generation (SSG): Pre-render pages that do not change per-user at build time using
export const dynamic = "force-static". This allows your edge CDN to serve raw HTML with single-digit millisecond TTFB. - Incremental Static Regeneration (ISR): Use
revalidateintervals to balance content freshness with edge-cached delivery. - Database Optimization: Index foreign keys, prune heavy ORM joins, and utilize connection pooling (e.g., Prisma Accelerate or PgBouncer).
Fix 3: Load Web Fonts With next/font and Zero Layout Shifts
External font links (such as unoptimized Google Fonts requests) trigger render-blocking network round-trips. Furthermore, when the final font face loads, text layout shifts frequently occur.
Next.js solves this at build time through next/font/google and next/font/local, downloading font binaries locally and automatically synthesizing matching size-adjust CSS fallbacks:
import { Inter } from "next/font/google";

const inter = Inter({
  subsets: ["latin"],
  display: "swap",
  variable: "--font-inter",
});

export default function RootLayout({ children }: { children: React.ReactNode }) {
  return (
    <html lang="en" className={inter.variable}>
      <body className="font-sans antialiased">{children}</body>
    </html>
  );
}
2. How to Improve Interaction to Next Paint (INP)
Interaction to Next Paint measures how rapidly the browser renders visual updates following user input. It replaces FID by evaluating interactions across the entire lifespan of the session, rather than merely the initial click.
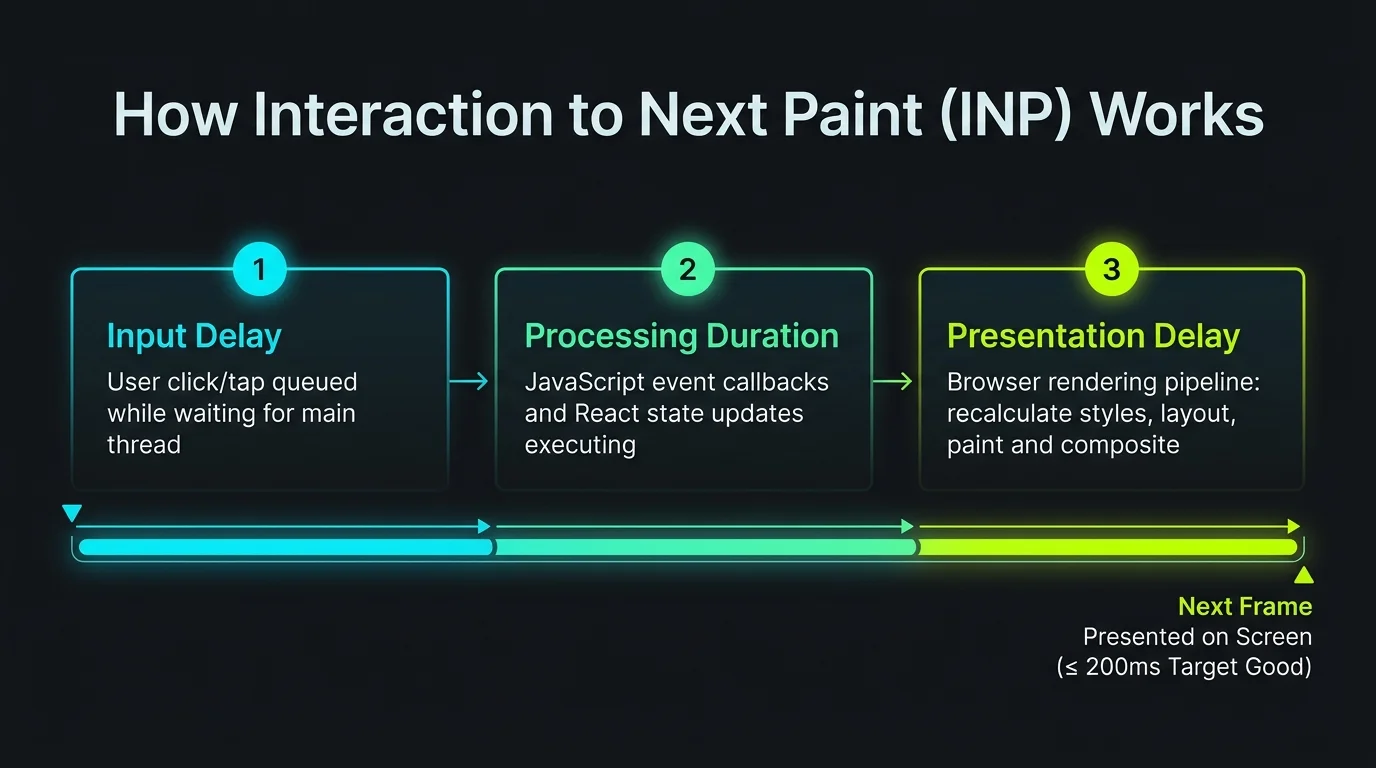
The INP latency profile consists of three distinct components:
- Input Delay: Time waiting for earlier queued tasks on the main thread to complete before the event listener starts running.
- Processing Duration: Execution time spent inside your JavaScript callbacks, React handlers, and state management reducers.
- Presentation Delay: Time required for the browser rendering engine to recalculate styles, perform layout, composite layers, and paint the next frame to screen.
Fix 1: Keep Client Component Boundaries As Small As Possible
In the App Router, every component is a Server Component by default. Server Components send pure HTML and zero JavaScript bytes to the browser. Avoid making entire page trees Client Components simply to access a single button's state:
// Bad Practice: Entire layout marked as client component
"use client";
export default function SearchLayout({ children }) { ... }

// Good Practice: Isolate interactive boundaries to leaf nodes
// src/components/search/SearchTrigger.tsx
"use client";
import { useState } from "react";

export function SearchTrigger() {
  const [isOpen, setIsOpen] = useState(false);
  return (
    <button onClick={() => setIsOpen(true)} aria-label="Open Search">
      Search
    </button>
  );
}
Fix 2: Defer Heavy Interactive Widgets Using next/dynamic
Interactive charts, rich-text markdown editors, data tables, and modal dialogs add substantial parsing and compilation overhead to the main thread. Defer them until required using dynamic imports:
import dynamic from "next/dynamic";

const TelemetryChart = dynamic(
  () => import("@/components/analytics/TelemetryChart"),
  {
    loading: () => <div className="h-64 animate-pulse bg-gray-100 rounded-xl" />,
    ssr: false, // Prevents loading heavy canvas libraries during server render
  }
);

export default function PerformanceDashboard() {
  return (
    <section>
      <h2>Live Latency Telemetry</h2>
      <TelemetryChart />
    </section>
  );
}
Fix 3: Yield Long Tasks to the Main Thread
Any JavaScript execution lasting longer than 50 milliseconds is categorized as a Long Task. When a user interacts while a long task is executing, the browser must queue the interaction, driving up Input Delay.
Break up extensive rendering tasks using React 19's useTransition or the modern browser scheduler.yield() API:
import { useTransition, useState } from "react";

export function FilterControls({ onApplyFilter }) {
  const [isPending, startTransition] = useTransition();
  const [activeTag, setActiveTag] = useState("all");

  const handleSelect = (tag: string) => {
    setActiveTag(tag); // Immediate visual feedback on selected button
    startTransition(() => {
      // Non-blocking state transition yields to user input
      onApplyFilter(tag);
    });
  };

  return (
    <div className="flex gap-2">
      <button onClick={() => handleSelect("lcp")}>LCP</button>
      {isPending && <span className="text-xs text-gray-400">Updating...</span>}
    </div>
  );
}
3. How to Improve Cumulative Layout Shift (CLS)
Cumulative Layout Shift occurs when visible DOM elements change coordinates while a visitor is reading or engaging with content. Layout shifts break reader immersion, cause accidental clicks on incorrect buttons, and trigger Google ranking penalties.
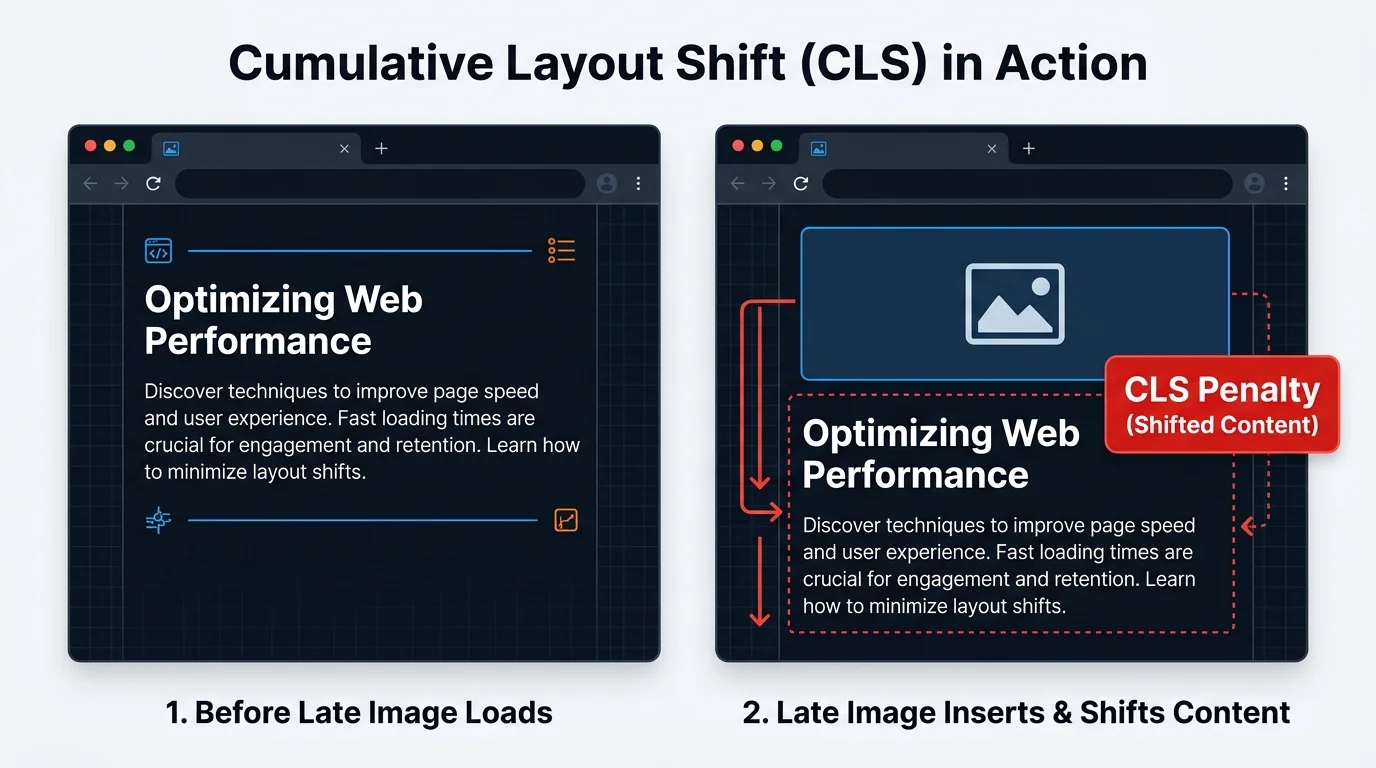
Fix 1: Explicitly Reserve Dimensions on All Media Containers
When images lack explicit width and height ratios, the browser initializes their DOM height at 0 pixels. When the file finishes downloading seconds later, the browser re-flows the layout, instantly shoving paragraphs, headings, and CTAs downward.
Always provide explicit width and height dimensions, or use modern CSS aspect-ratio utility classes:
// Approach A: Explicit Next.js Image dimensions
<Image
  src="/images/diagram.webp"
  alt="Performance pipeline"
  width={1200}
  height={675}
  className="w-full h-auto"
/>

// Approach B: Dynamic parent container with fixed aspect ratio
<div className="w-full aspect-video relative">
  <Image
    src="/images/embed-poster.webp"
    alt="Video poster"
    fill
    className="object-cover"
  />
</div>
Fix 2: Reserve Space for Dynamic Third-Party Embeds and Banners
Dynamic advertisements, cookie consent notices, and embedded newsletter subscription boxes are infamous sources of late layout shifts. Never inject an element above existing content unless the user explicitly requested it (e.g., expanding an accordion).
/* Reserve min-height container for dynamic ads or widgets */
.ad-slot-container {
  min-height: 250px;
  background-color: #f8fafc;
  display: flex;
  align-items: center;
  justify-content: center;
}
Fix 3: Animate Solely With Composited CSS Properties
Animating properties that trigger layout re-calculation (such as top, left, width, height, or margin) causes layout recalculation on every animation frame. Instead, restrict all transition effects to hardware-accelerated, composited properties: transform and opacity.
4. How to Measure Core Web Vitals in Next.js
Performance engineering must be guided by empirical data. Optimizing code without measuring first leads to wasted effort on non-bottlenecks. A disciplined methodology balances lab diagnostics with real-user field telemetry.
Field Data vs. Lab Data
| Dimension | Field Data (RUM / CrUX) | Lab Data (Lighthouse / DevTools) |
|---|---|---|
| Measurement Source | Real visitors on actual mobile & desktop hardware | Simulated runs under synthetic network throttling |
| Primary Purpose | Determine true user experience & Google ranking compliance | Diagnose, reproduce, and debug specific code bottlenecks |
| INP Accuracy | Tracks real user clicks across full multi-minute sessions | Synthetic (cannot simulate nuanced real-user interaction sessions) |
| Tools | Google Search Console, PageSpeed Insights (CrUX), Vercel Speed Insights | Chrome DevTools Performance Panel, Lighthouse CI |
Instrumenting Real User Monitoring in Next.js
Next.js includes first-party support for capturing real-user vitals via the useReportWebVitals hook from next/web-vitals. In the App Router, encapsulate this in a dedicated client component imported into your root layout:
// src/components/analytics/WebVitals.tsx
"use client";

import { useReportWebVitals } from "next/web-vitals";

export function WebVitals() {
  useReportWebVitals((metric) => {
    const payload = JSON.stringify({
      name: metric.name,     // LCP, INP, CLS, FCP, TTFB
      value: metric.value,   // Metric value (ms or score)
      rating: metric.rating, // "good" | "needs-improvement" | "poor"
      id: metric.id,         // Unique ID for the page load
      navigationType: metric.navigationType,
    });

    // Dispatch beacon to your analytics ingestion endpoint
    if (navigator.sendBeacon) {
      navigator.sendBeacon("/api/telemetry/vitals", payload);
    }
  });

  return null;
}
Import <WebVitals /> into your src/app/layout.tsx. Because it renders null, it adds zero DOM overhead while delivering high-fidelity performance metrics straight to your data warehouse.
5. A Practical Core Web Vitals Debugging Workflow
Rather than randomly refactoring components, follow this six-step production debugging cycle:
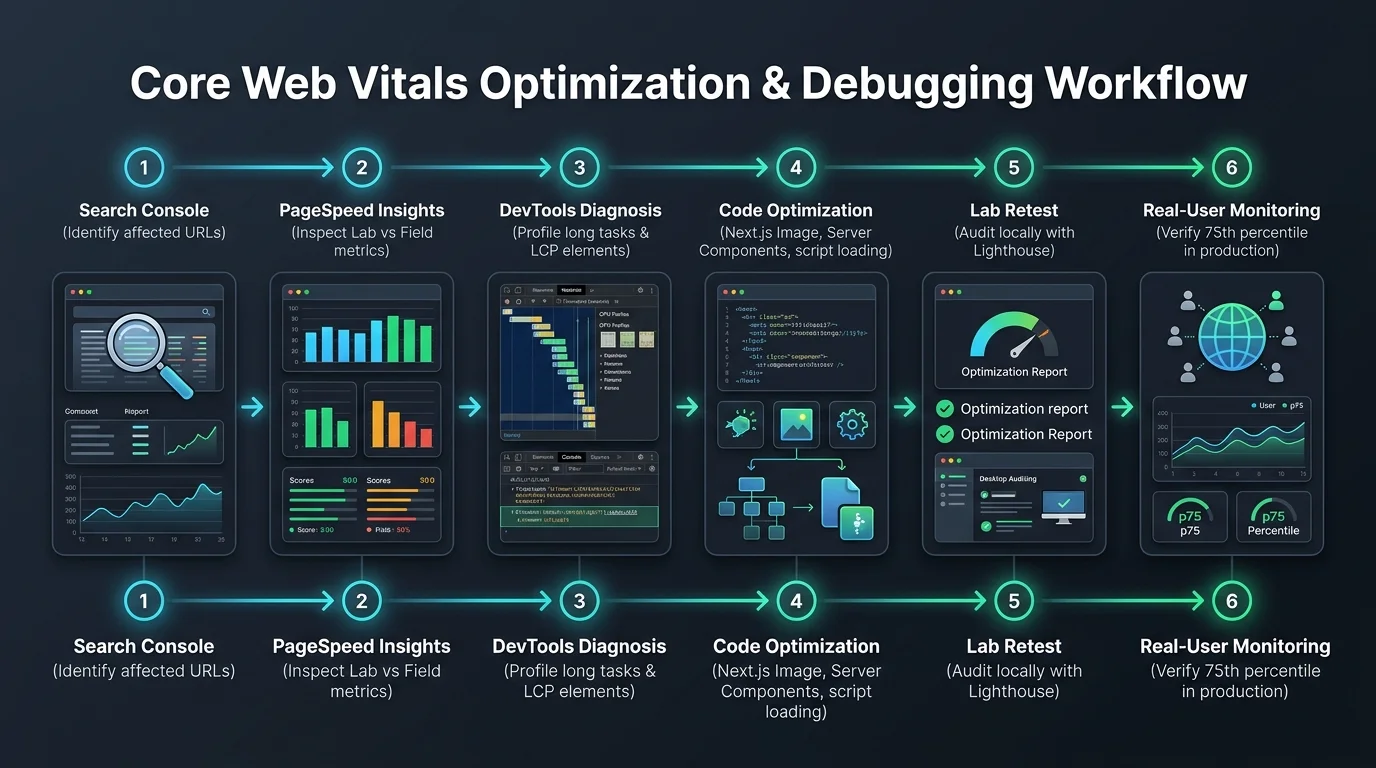
- Step 1: Identify Affected URLs in Search Console: Navigate to the Core Web Vitals section in Google Search Console. Filter by device (Mobile vs. Desktop) and identify groups of similar URLs flagging "Needs Improvement" or "Poor."
- Step 2: Reproduce the Issue: Run representative URLs through Google PageSpeed Insights and record whether field data mirrors the synthetic audit.
- Step 3: Diagnose Bottlenecks in Chrome DevTools: Open the Performance panel with 4x CPU throttling. Record a trace while clicking interactive elements:
- For LCP: Identify whether the bottleneck is TTFB, Load Delay, Load Duration, or Render Delay.
- For INP: Check the "Interactions" track for long red bars and inspect call trees for expensive event handlers.
- For CLS: Check the "Layout Shifts" track to see which DOM nodes are displaced.
- Step 4: Implement Targeted Code Fixes: Apply specific architectural solutions (e.g., setting
priorityon hero images, splitting client component trees, reserving aspect ratios). - Step 5: Verify in Lab Retest: Re-run local Lighthouse audits and DevTools traces to verify that long tasks and layout shifts have been eliminated.
- Step 6: Monitor 75th-Percentile Field Telemetry: Deploy to production and track your custom RUM telemetry over the subsequent 28-day CrUX collection window to confirm real-world user improvements.
6. Next.js Performance Optimization Checklist
Use this verification checklist prior to launching new templates or executing major application refactors:
| Architecture Area | Production Verification Check | Target Metric |
|---|---|---|
| Hero Media | Primary LCP image uses next/image with priority and responsive sizes |
LCP |
| Server Delivery | Public marketing pages use static export (SSG) or ISR with edge caching | LCP (TTFB) |
| Typography | Fonts loaded via next/font with display: 'swap' and subset restrictions |
LCP / CLS |
| Client Boundary | "use client" isolated strictly to leaf nodes requiring interactive hooks |
INP |
| Dynamic Loading | Heavy client widgets (charts, editors, modals) imported via next/dynamic |
INP |
| Layout Containment | All images, video embeds, and banners have explicit aspect ratios or reserved heights | CLS |
| Third-Party Scripts | Analytics, pixels, and tag managers loaded with next/script using strategy="afterInteractive" or strategy="lazyOnload" |
INP / TBT |
| Animations | All CSS transitions operate strictly via transform and opacity |
CLS |
| Observability | Field telemetry captured continuously via useReportWebVitals |
All Vitals |
7. Common Core Web Vitals Mistakes to Avoid
- Chasing Synthetic 100/100 Scores Exclusively: A perfect score on desktop Lighthouse does not guarantee compliance on mobile networks. Focus on real-world 75th percentile field telemetry in Search Console.
- Lazy-Loading the Hero Image: Adding
loading="lazy"to your above-the-fold banner prevents the browser from discovering the image until after the layout pass, drastically delaying LCP. - Spreading
"use client"Indiscriminately: Making large parent components client-side forces unnecessary React hydration across static subtrees, inflating bundle size and slowing user interactions. - Overusing Preload Tags: Preloading non-critical fonts, auxiliary scripts, and below-the-fold images causes network contention that delays the actual LCP asset.
- Neglecting Mobile Viewports: Fast desktop connections can mask heavy client bundles. Always inspect mobile metrics independently under simulated mid-tier mobile throttling.
Architecting Next.js for Long-Term Speed & Stability
Optimizing Core Web Vitals in Next.js is not an isolated post-launch task or a matter of installing a third-party plugin. It is an ongoing architectural practice that bridges code structure, asset management, and browser runtime mechanics.
By prioritizing the LCP hero resource, isolating client component boundaries, deferring non-essential JavaScript, reserving strict geometric layout constraints, and monitoring real-user field telemetry, engineering teams can build Next.js applications that consistently deliver lightning-fast, visually stable experiences across every device.